In the past century, the development of tropical cyclone (TC) forecasting technology in China has experienced several main stages, such as cloud identification, weather chart analysis, statistical forecasting, statistics–dynamic forecasting, numerical forecasting and their integrated application. As a result, the capability in forecasting TC in China has significantly improved in both accuracy and stability, with noticeable stepwise features corresponding to the developments in forecasting technology. Looking ahead, forecasting of TCs has entered a new phase to breakthrough the bottlenecks of fine structure and long lead time forecasting. The integrated development of physical law understanding and artificial intelligence technology is anticipated to catalyze a new leap in capability.
Tropical cyclones (TCs) are the primary meteorological phenomena contributing to weather-related disasters in China, resulting in an average direct economic loss of tens of billions of yuan annually and affecting over 30 million people each year. Accurate forecasting of TCs and their associated wind and rainfall impacts is a crucial prerequisite for mitigating TC disaster losses. This paper reviews the significant historical phases in the development of TC forecasting technology in China over the past century, highlighting recent advancements in forecasting capabilities as evidenced by the accuracy of official TC forecasts issued by the China Meteorological Administration (CMA). Finally, this study explores potential future advancements in TC forecasting technology, particularly considering the new wave of scientific and technological revolution driven by developments in artificial intelligence.
2.
Main developmental stages of TC forecast technology in China in the past hundred years
2.1
1910s–1940s: the start and widespread application stage of weather map analysis
During the period between 1910s and 1940s, the TC analysis and prediction work in China has begun to show the characteristics based on modern meteorology theory and vortex dynamics theory in addition to inheriting and carrying forward the traditional means of observing the clouds and recognizing the sky. Importantly, the weather map analysis technology was introduced at this stage. Before and during the early part of that period, China’s weather forecast was controlled in the meteorological agencies established by foreigners. With the efforts of Mr Jiang Bingran and other ancestors, the first weather map of China drawn by the Chinese was officially released in 1915 (Jiang, 1936). Since then, the weather map analysis method has gradually become one of the main means of weather forecast in China, and so is the TC forecast. Wang (1918a, b, c, d; 1919a, b) summarized the TC forecast method at that time as follows: “In front of the direction of the typhoon, cirrocumulus, cirrus stratus, cirrus in sequence, and stratocumulus clouds behind it, this is a constant example. In terms of optical phenomena, halos and auras typically manifest prior to the arrival of a typhoon. Consequently, cirrus clouds were noted in the sky before the typhoon was observed. See the various phenomena, and investigate the direction of the wind, and can predict the discovery of the typhoon.” As for the TC track forecast, Wang (1918a, b, c, d; 1919a, b) wrote “By observing the speed of the center of a typhoon on a daily weather chart to determine its direction, the arrival of a typhoon can be predicted several days in advance. This is how storm forecasts are being made by weather stations all over the world”. Based on three years of observations and analyses of weather maps, Huang (1928) synthesized omens related to wind, waves, temperature, pressure, clouds, and sky conditions during typhoons at varying distances from Dongsha Island in the South China Sea, as well as during typhoon approaches. Lu (1935) expanded on the principles of the “Barometric Prediction Method” and its specific application in forecasting landfalling typhoons. This method primarily utilizes the “Isobaric Change Map,” enabling predictions of typhoon movement through analyzing the shift of positive and negative centers of isobaric lines preceding actual high and low pressure movements. Additionally, variations in the central values of isobaric lines can serve as indicators for typhoon intensification or weakening. Lu (1935) further suggested developing “standard path maps for forecasters’ reference” by categorizing historical weather maps on a daily basis for each month and systematizing typhoon paths by month to streamline and standardize forecasting practices. This underscores the core concept of the historically analogous forecasting technique prevalent among forecasters today.
2.2
1950s–1960s: semi-objective synoptic method development stage
During this period, a relatively comprehensive operational framework was formulated for TC surveillance, data dissemination, forecast services, and warning issuance (Chen, 2021). TC forecasting methodologies during this era can be categorized into three types: (1) considering TCs as point vortices and deducing their motion direction and velocity using steering currents derived from multi-layer atmospheric environmental flow calculations; (2) determining TC movement direction and speed through averaging climatic parameters and extrapolation factors, abbreviated as CLIPER; and (3) integrating synoptic models, point-focus maps, and forecasting indices. Wang and Luan (1964), for instance, devised a semi-objective medium-range TC track forecasting technique by selecting synoptic factors influencing TC motion from 500-hPa upper-air charts, grounded in forecasting expertise. This technique institutionalized forecasters’ practical knowledge through a series of nomographic procedures, marking the dawn of empirically selected synoptic factors in objective TC track forecasting. Following this, many local meteorological observatories utilized similar methodologies to develop applications for predicting TC tracks and associated heavy rainfall.
2.3
1970s–1990s: widespread adoption of objective statistical forecasting methods and nascent tage of numerical forecasting technology
In 1972, the Central Meteorological Bureau at the time set up a “Leading Group” and a “Technical Group” for national TC scientific research collaboration (Lei, 2020). This nationwide collaborative effort fostered the evolution of objective TC forecasting techniques combining synoptic methods with statistical mathematical models, transitioning from previous reliance on empirical synoptic analysis-based judgments. Significant strides were made in enhancing objectivity and quantification. The Technical Group tasked with national TC scientific research collaboration was responsible for assessing the errors and reporting rates of objective TC forecasting methods. Qualifying methods were required to relay real-time forecasting results via communication circuits for operational utilization by meteorological observatories across the country, hence earning the moniker of operational forecasting guidance. This practice persists to this day, with the National Typhoon and Marine Meteorological Expert Working Group currently overseeing the evaluation of operational forecasting guidance.
A summary of the historical TC track and intensity forecast guidance employed by CMA over the years is presented in Table 1. It is evident that from the 1970s to the 1990s, the predominant method was stepwise regression analysis. This involved establishing linear statistical relationships between forecast factors and forecast objects through a stepwise regression approach. Forecast factors encompassed climatic persistence factors and/or synoptic factors, such as steering currents and circulation indices, while forecast objects comprised TC positions, intensities, or their respective changes (Jin et al., 1983). These methods were utilized by the Central Meteorological Observatory and local meteorological observatories at various levels, encompassing forecasts for the entire western North Pacific Ocean, individual provinces, and even counties (Shu et al., 1983).
Table
1.
List of objective tropical cyclone track and intensity forecast methods operated in CMA (1970s to present)
Another classification includes the amalgamation of statistical and dynamic methods, which took diverse forms. One example is the steering current correction method (Dong et al., 1974; Wang and Piao, 1978). Based on isobaric surface height forecasts, this technique employed corrected single-layer (500 hPa) or double-layer (500 and 850 hPa) steering currents for TC track forecasting. The correction largely relied on the forecaster’s experience. Another variant treated the primary term in the dynamic equation, specifically the pressure gradient force term, as a stochastic process. This retained the fundamental physical mechanisms describing atmospheric processes within the dynamic equation, while utilizing probability and statistical methods to address physical quantities that were difficult to ascertain or impractical to include in the dynamic process. This methodology was introduced by the Shanghai Typhoon Collaboration Group in 1974 (Shanghai Typhoon Collaborative Group, 1975) and underwent three stages of evolution: SD-75, SD-85, and SD-90.
The Model Output Statistics (MOS) interpretation and forecast method incorporated numerical weather prediction fields, combined with additional factors, for statistical purposes (Ni and Xue, 1980). Methods such as analog forecasting and discriminant forecasting were also prevalent during this period. Among them, discriminant forecasting aimed to derive a qualitative forecast conclusion, such as predicting TC landfall or whether a region would be impacted by gale-force winds and heavy rainfall.
Numerical TC forecasting in China commenced approximately in 1965. Initially, a single-layer barotropic vorticity equation at 500 hPa was utilized (Dong et al., 1974), followed by the development of barotropic primitive equation models (Ni et al., 1980) and nested grid models featuring large and small grids (Wang and Piao, 1983; Zhu et al., 1982). Regarding numerical calculation methods, the total energy conservation scheme (Guo, 1983) and spline function method (Wang and Piao, 1981) were devised. The Liaoning Meteorological Science Research Institute developed the LN-1 model, the earliest numerical forecast model to enter operational issuance, in the 1980s (Wang and Piao, 1983). Its distinctive characteristic was forecasting northward-moving TC tracks.
After entering the 1990s, through the key scientific and technological research projects of the “Eighth Five-Year Plan,” the National Meteorological Centre (NMC), Guangzhou and Shanghai Regional Meteorological Centres developed and established numerical TC track forecast operational systems for the western North Pacific Ocean, South China Sea, and East China Sea, respectively, issuing forecasts nationwide. Among them, the National Meteorological Centre devised the Mesoscale Typhoon Track Prediction (MTTP) model, denoted as TMBJ-1 in Table 1, grounded on the Limited-area Fine Mesh Model (HLAFS) (Wang and Li, 1994). MTTP incorporates artificial vortex initialization techniques alongside a dual-nested grid framework, featuring coarse and fine grid resolutions of 0.9375° and 0.46875° respectively. The dynamical backbone of the TC Track Model for the East China Sea (STM) (Gu et al., 2000) is the PSU/NCAR Mesoscale Model 4 (MM4), utilizing horizontal grids spanning 150 km and 50 km in a dual-nested arrangement. Lateral boundary conditions for the outer domain stem from the global spectral model forecast fields of the National Meteorological Centre. The numerical TC prediction model tailored for the South China Sea (Wang et al., 1996) is anchored in the Tropical Limited Area Mesoscale Prediction System (TL6), deploying a dual-nested grid system with resolutions of 333 km and 111 km. Despite failing to outshine statistical or statistical–dynamical methods at the time, these models vigorously propelled the holistic progression of TC model technology research across China, establishing a pivotal foundation for the swift subsequent evolution of TC numerical prediction technology in China.
2.4
2000s to now: a stage of rapid development and integrated application for TC numerical prediction technology
At the dawn of the 2000s, CMA embarked on the development of the Global/Regional Assimilation and Prediction System (GRAPES). Soon after, the Shanghai Typhoon Institute of CMA started the development of GRAPES-TCM, a TC Model based on GRAPES, which came into operational use in 2006 (Huang et al., 2009; Huang and Liang, 2010). The Guangzhou Institute of Tropical and Marine Meteorology initiated the Tropical Regional Assimilation and Modeling System (TRAMS), a tropical regional numerical weather prediction system built upon GRAPES and TL6 models, also recognized as the South China Sea TC Model, with Version 1.0 coming into operational use in 2011 (Chen et al., 2020). The National Meteorological Centre’s GRAPES Typhoon Model (GRAPES-TYM) (Ma et al., 2018, 2021) entered operational service in 2012. The vortex initialization strategy, grounded in the GRAPES-4DVar variational assimilation system, was integrated into the GRAPES Global Forecast System (GRAPES-GFS, alias CMA-GFS), operational since 2015, to bolster its TC track prediction capabilities (Ma et al., 2021). Other systems operationalized in the 2010s include the Typhoon Regional Assimilation and Prediction System (T-RAPS), evolved or upgraded based on the Weather Research and Forecasting (WRF) model (Duan et al., 2019), the Shanghai Weather and Risk Model System for TC Prediction (SWARMS-TC), and the Liaoning TC Numerical Prediction Model (LNTCM). The development of this array of regional numerical prediction systems for TCs has persistently received funding from several national flagship scientific research initiatives, such as the National Basic Research Program (973 Program), pivotal special projects under the National Key Research and Development Program, and significant research endeavors of the National Natural Science Foundation of China. Significant advancements have been achieved in TC vortex initialization, assimilation of diverse remote sensing data sources, and parameterization of physical processes (Ma, 2014; Duan, 2015; Duan et al., 2019; Zhou et al., 2019), markedly boosting China’s TC numerical prediction capabilities. Efforts have centered on refining model initial conditions, leading to the sequential development of artificial vortex assimilation technology (Huang et al., 2007; Wang et al., 2008) and vortex recycling initialization technology (Liang et al., 2007a). Research has additionally delved into the assimilation of multi-source satellite data, encompassing satellite cloud wind derivation, Advanced Microwave Sounding Unit-A (AMSU-A), Tropical Rainfall Measuring Mission (TRMM), High Resolution Infrared Radiation Sounder Version 3 (HIRS/3), Geostationary Interferometric Infrared Sounder (GIIRS), and radar data assimilation techniques (Wang et al., 2005; Liang et al., 2007b). Within model physical process development, notable innovations include a convective triggering mechanism for parameterization schemes (Ma and Tan, 2009), a novel ocean–atmosphere–wave coupling technology (Zheng et al., 2015), and an innovative helicity diagnostic method for TC boundary layer height (Ma and Bao, 2016). As supercomputer performance has steadily improved, numerical prediction systems for TCs have seen their horizontal resolution diminish from hundreds of kilometers initially to below 10 km, with the finest resolutions reaching 1–3 km. Current research emphases encompass high-resolution TC data assimilation techniques harmonized with this resolution augmentation (e.g., Luo et al., 2022) and TC model physical process parameterization schemes tailored for “gray zone” scale resolutions (e.g., Zhang et al., 2018, 2023; Zhu et al., 2024).
In tandem with the swift development of deterministic TC numerical prediction models, TC ensemble prediction systems (EPS) have evolved to quantitatively assess forecast uncertainty (Zhang et al., 2022). Zhou et al. (2003) spearheaded ensemble forecasting of TC tracks in China using barotropic primitive equation models. In 2018, TC singular vector perturbations were integrated into the global ensemble prediction system—CMA-GEPS, bolstering its TC ensemble prediction prowess. Also in 2018, the TC mesoscale ensemble prediction system TRAMS-EPS, based on TRAMS, commenced operational trials (Zhang, 2018). The Typhoon Ensemble Data Assimilation and Prediction System (TEDAPS) in the current operational forecasting framework of CMA leverages SWARMS-TC (Li et al., 2019). This system employs a hybrid 3DVAR-EnKF data assimilation approach, incorporates ensemble background error information aligned with flow patterns, and accounts for both initial value perturbations and perturbations within model physical process parameterization schemes. It underwent an upgrade from a 27 km resolution to a 9 km resolution in 2024, featuring 21 ensemble members.
At this juncture, statistical and statistical–dynamic approaches for TC track forecasting have retreated into historical obscurity. Nevertheless, various statistical methods for TC intensity forecasting remain in widespread use today, retaining forecasting capabilities that rival or surpass numerical forecasts (Shanghai Typhoon Institute of China Meteorological Administration, 2024). Among these are the Western North Pacific TC Intensity Prediction System (WIPS), Tropical Cyclone Statistical Persistence scheme (TCSP), and the Artificial Neural Network for Genetic Algorithm tailored for South China Sea TC intensity forecasting (ANNGA). Furthermore, the Central Meteorological Observatory has devised an Aartificial Intelligence (AI) algorithm for predicting abrupt TC intensity changes through satellite cloud image recognition, capable of identifying rapid intensification processes with a lead time of approximately 12 h (Zhou et al., 2022).
Following the establishment of an operational access mechanism for objective TC forecasting methods in the 1970s, forecasters at CMA could concurrently refer to multiple forecasting guidance in real-time operations, recognizing the potential of integrating superior sub-methods to form an ensemble forecasting model (Shu and Wang, 1983). Additionally, the World Meteorological Organization (WMO) fostered an international real-time data exchange, facilitating the dissemination of cutting-edge TC forecasting technologies and products globally. Consequently, China embarked on research and applications of consensus forecasting methods as far back as the 1970s (Shantou Meteorological Observatory, Guangdong Province, 1975). The Shanghai Track Consensus (STC) scheme for operational TC track ensemble forecasting in the 1990s encompassed four sub-methods, including three statistical forecasting techniques and one contemporary international numerical forecasting method—the Japan Meteorological Agency’s Regional Typhoon Model. As the 2010s began, traditional statistical and statistical–dynamic methods became increasingly outdated. In response, a multi-model ensemble forecasting technique for tropical cyclone (TC) track prediction, known as Shanghai multi-model ensemble (SHME), was fully developed, relying on numerical forecast products (Guo et al., 2019). Its sub-methods involve SWARMS-TC,TRAMS, as well as high-resolution model from the European Centre for Medium-Range Weather Forecasts (ECMWF-HRES), the National Centers for Environmental Prediction’s Global Forecast System (NCEP-GFS), and the United Kingdom Met Office’s Unified Model (UKMO-UM).
One prominent challenge for forecasters following the ubiquitous adoption of ensemble forecasting technology lies in swiftly extracting valuable information from extensive datasets. In 2010, China initiated the WMO Typhoon Landfall Forecast Demonstration Project (TLFDP) (Yu et al., 2024), which has significantly advanced the application of ensemble forecast products in TC forecasting operations in the country. Notable milestones include the introduction of SEAV technique for track forecasts (Qi et al., 2014) and the operational deployment of the Typhoon Track Ensemble Correction (TYTEC) technology at the Central Meteorological Observatory (Qian et al., 2014). This technology hinges on two core principles: first, utilizing EPS product time lags to select members whose short-term forecast errors meet specified criteria from the entire EPS ensemble; second, applying linear translation corrections to these selected members based on their short-term forecast errors.
It is worth noting that the integration technologies prevalent in the aforementioned operations primarily concentrate on TC track forecasting. Meanwhile, the multi-method integration for TC intensity and rainfall forecasting still heavily relies on subjective analysis conducted by forecasters. The limitations of individual sub-methods, including the stability of TC intensity and rainfall forecasts, the rationality of uncertainty representation, and the timeliness of forecast product delivery, are the principal constraints impeding the real-time operational deployment of these technologies.
3.
Current TC forecast capability in CMA
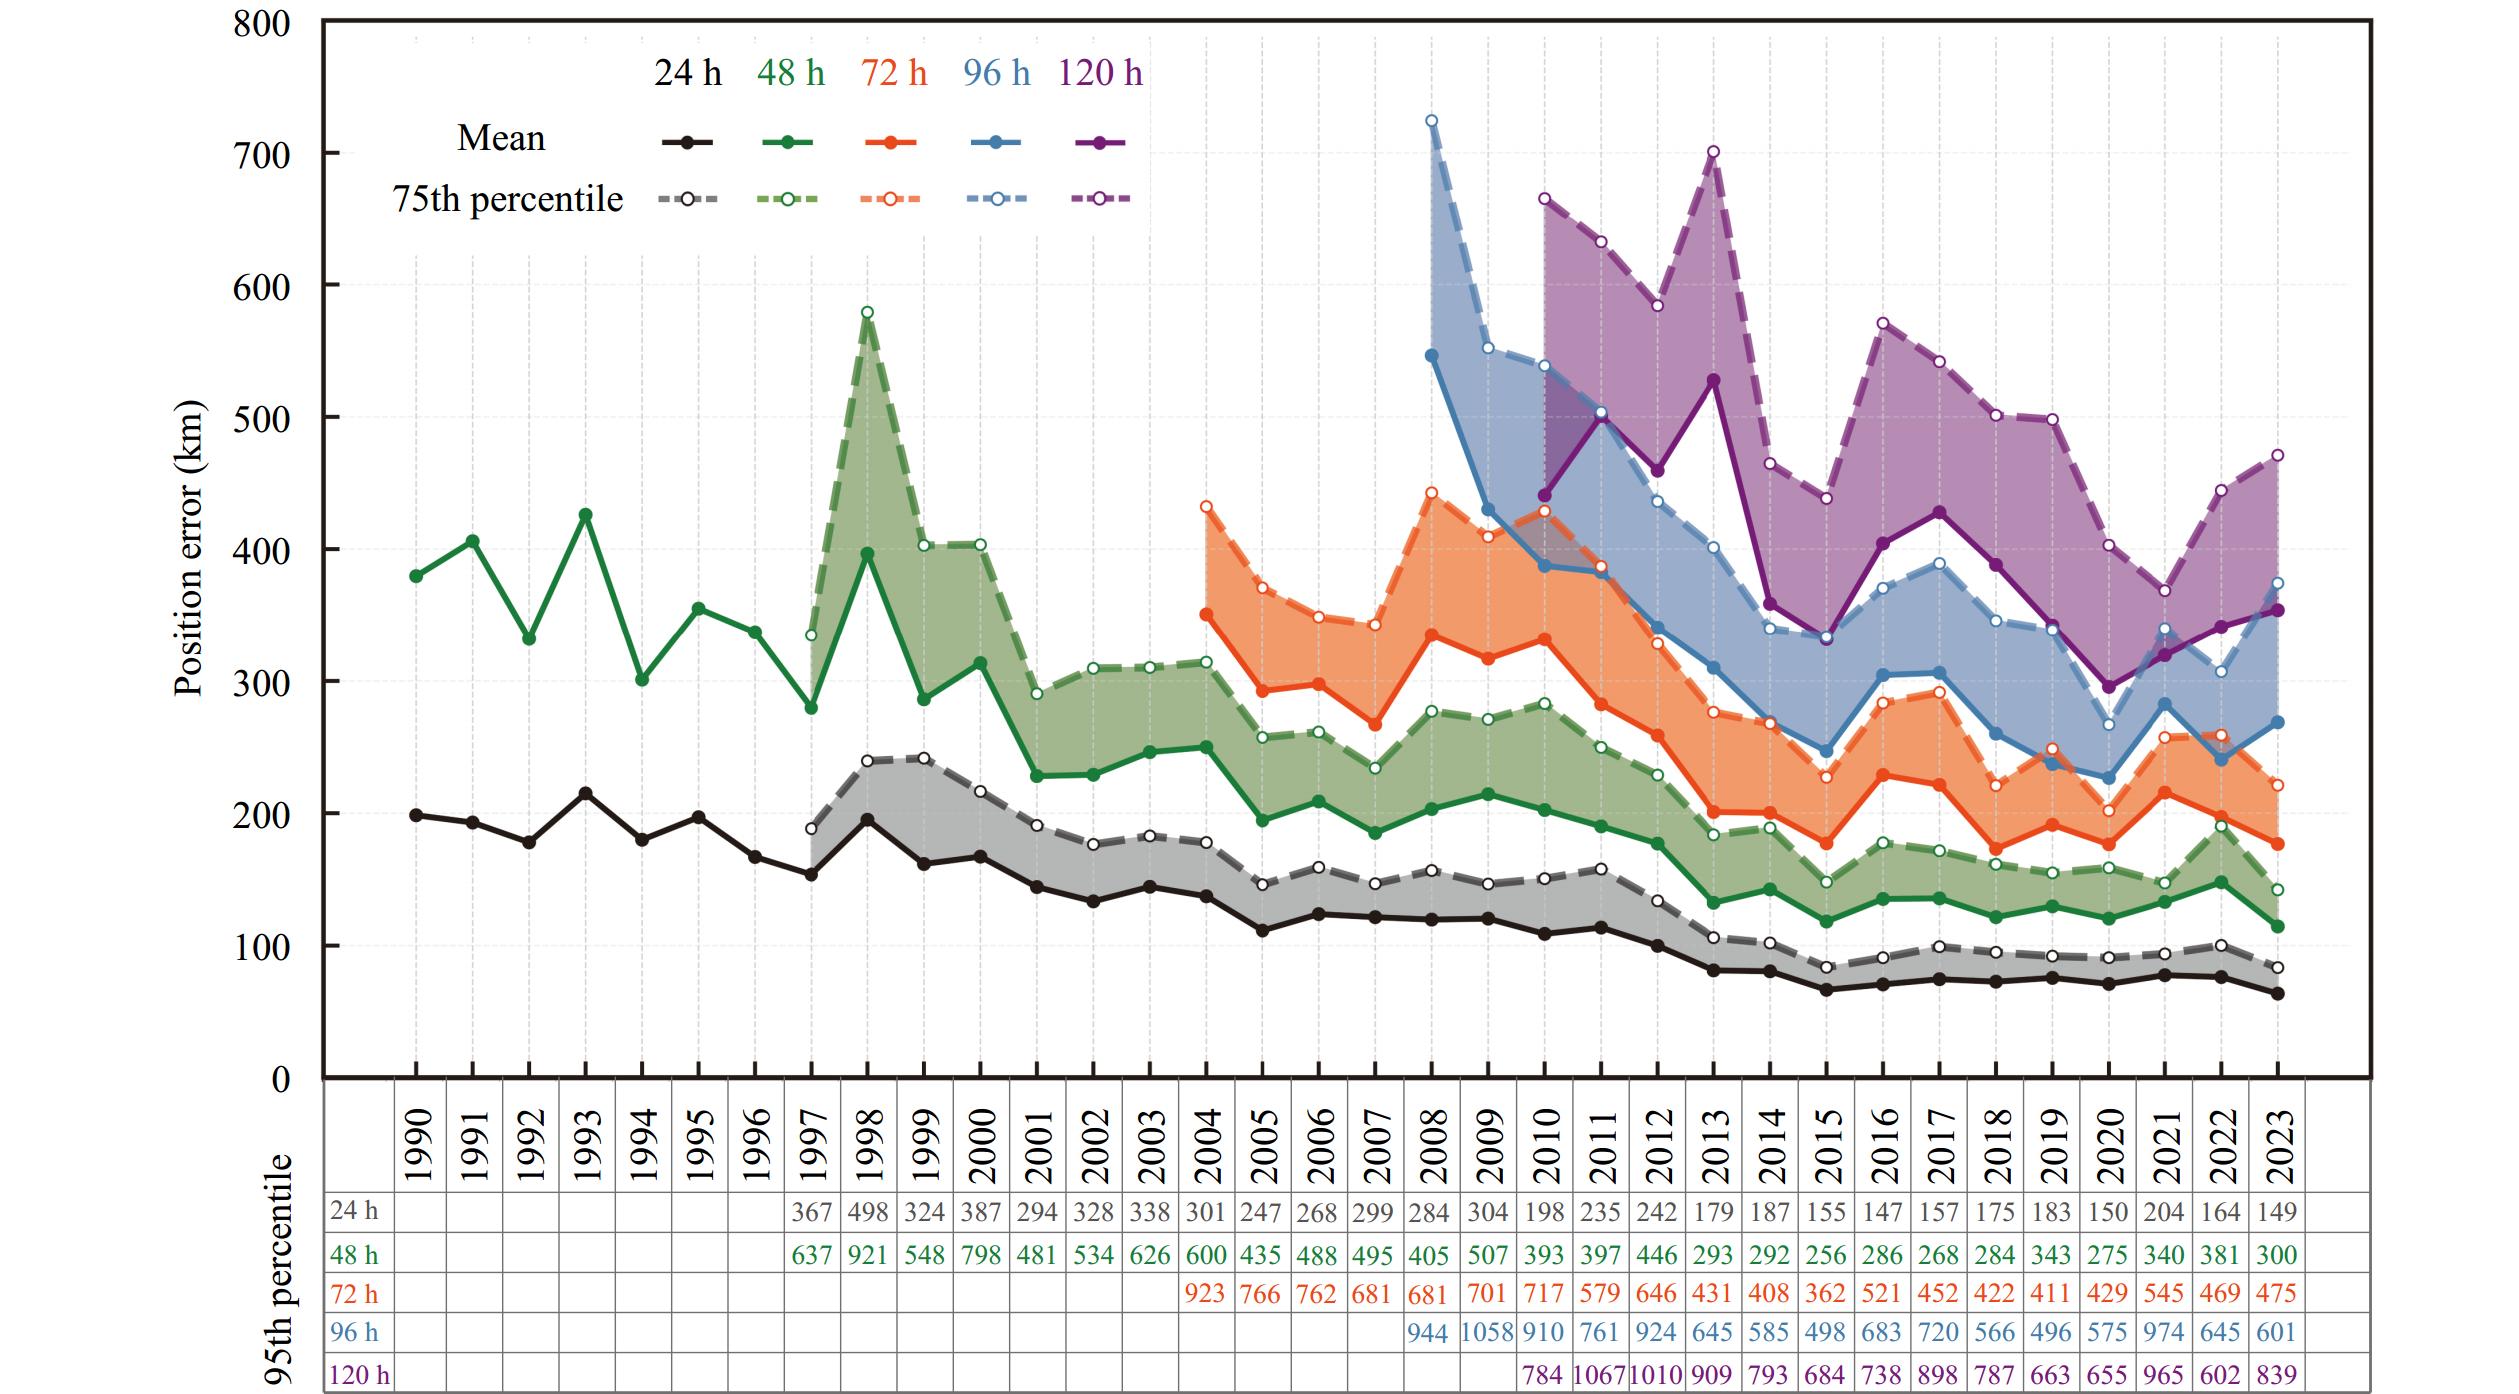
During the early 1980s, the average 24-h forecast error for TC tracks was approximately 200 km in CMA, with the 48-h forecast error reaching nearly 430 km (Shu and Wang, 1983). This status persisted without notable enhancements until the mid-1990s (Fei et al., 1999). However, the subsequent three decades witnessed significant advancements in TC track forecasting. The annual average 24-h (48-h) track forecast error decreased by 39–49 km (81–99 km) per decade, equivalent to an average annual reduction of 3%–4%, and the effective forecast lead time was extended by 2 days. Improvements in the lead time of objective TC forecasting methods led CMA to extend TC track and intensity forecast lead times from 48 h to 72, 96, and 120 h in 2001, 2008, and 2010, respectively. In 2023, the average track forecast errors for various lead times were 64 km (24 h), 115 km (48 h), 175 km (72 h), 269 km (96 h), and 362 km (120 h). Yu et al. (2022) analyzed the annual average error series for 24-h TC track forecasts post-1990s and identified mutation points in the early 2000s and 2010s. Following each mutation, there was a concurrent enhancement in the accuracy and stability of the 24-h TC track forecasts. This indicates that advancements in tropical cyclone forecasting capabilities do not progress incrementally from year to year, but rather demonstrate significant step-wise improvements. Yu et al. (2022) further analyzed and attributed the reduction in TC track forecast errors over the past 20 years primarily to the decrease in initial value errors, while the error growth rate with forecast lead time has remained largely unchanged. In addition to the annual average error, Fig. 1 depicts the yearly evolution of the 75th and 95th percentile error values for various forecast lead times. The figure indicates that the overall trends of both percentiles are broadly consistent with the average error, suggesting that improvements in average forecasting capabilities are accompanied by simultaneous enhancements in the stability of track forecasts. Notably, extreme forecast errors, represented by the 95th percentile value, can surpass twice the average error. For instance, in 2023, the average values for 24- and 120-h errors were 64 km and 362 km, respectively, whereas the 95th percentile values reached 149 km and 839 km. With diminishing room for improvement in average TC track forecasting capabilities, greater attention should be directed towards mitigating extreme forecast errors.
Fig
1.
Annual track forecast errors of CMA (1990–2023). The solid lines represent the annual mean position errors, the dashed lines represent the 75th percentile of the position errors, and the table below shows the 95th percentile of the position errors (km; different colors represent different forecast lead times).
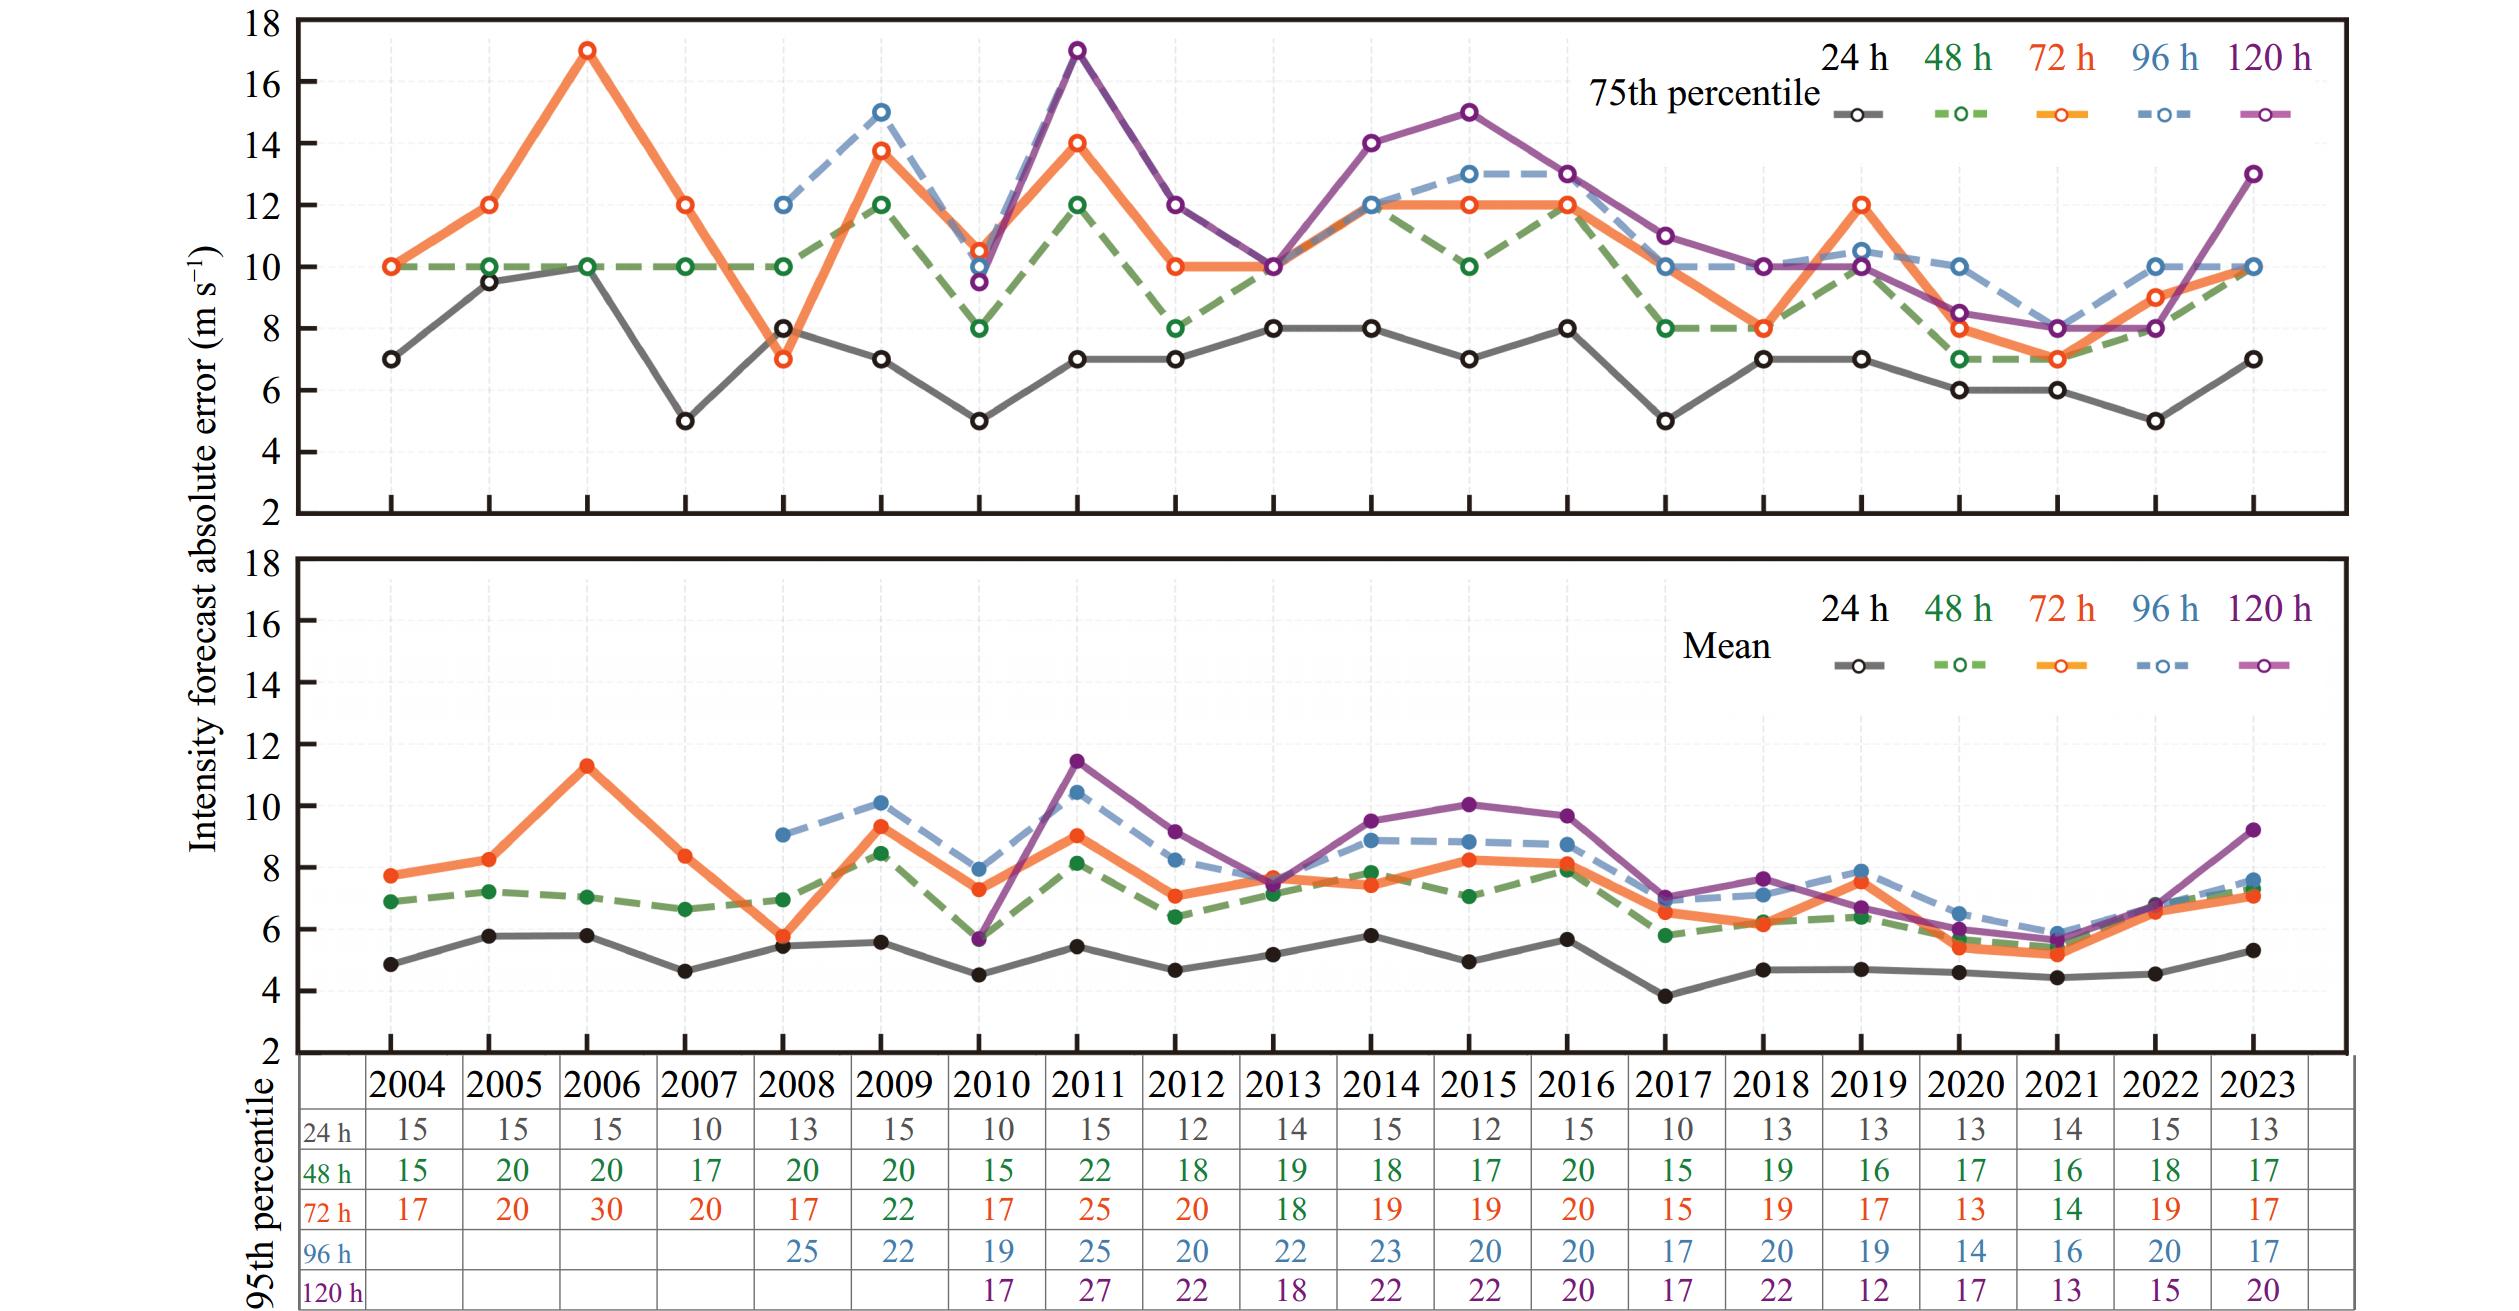
Over the past two decades (spanning from 2004 to 2023), CMA’s mean absolute errors (MAEs) in forecasting the maximum near-center winds, for lead times ranging from 24 to 120 h, stood at 5 m s−1 (24 h), 6.9 m s−1 (48 h), 7.7 m s−1 (72 h), 13.2 m s−1 (96 h), and 14.2 m s−1 (120 h), respectively. The annual average error curves depicted in Fig. 2 reveal three notable shifts in TC intensity forecasting proficiency approximately around 2017. Firstly, an overall reduction in MAE was observed; pre-2017 averages were 5.2 m s−1 (24 h), 7.2 m s−1 (48 h), 8.2 m s−1 (72 h), 13.8 m s−1 (96 h), and 15.4 m s−1 (120 h), which then declined to 4.6 m s−1 (24 h), 6.3 m s−1 (48 h), 6.4 m s−1 (72 h), 12.2 m s−1 (96 h), and 12.7 m s−1 (120 h), marking an improvement rate between 12% and 22%. Secondly, the growth rate of annual mean error with forecast lead time decreased, shifting from an average of 0.11 m s−1 per hour pre-2017 to 0.08 m s−1 per hour thereafter. Thirdly, interannual variability decreased, with the standard deviation of the annual average error decreasing from 0.48 m s−1 pre-2017 to 0.44 m s−1 post-2017. The annual variation patterns of the 75th and 95th percentile values mirrored those of the MAE. In 2023, the 95th percentile values for varying forecast lead times peaked at 13 m s−1 (24 h), 17 m s−1 (48, 72, and 96 h), and 20 m s−1 (120 h).
Fig
2.
Annual intensity forecast errors of CMA (2004–2023). The lower graph shows the mean absolute errors, the upper graph shows the 75th percentile of the absolute errors, and the lower table shows the 95th percentile of the absolute errors (m s−1. Different colors represent different forecast lead times).
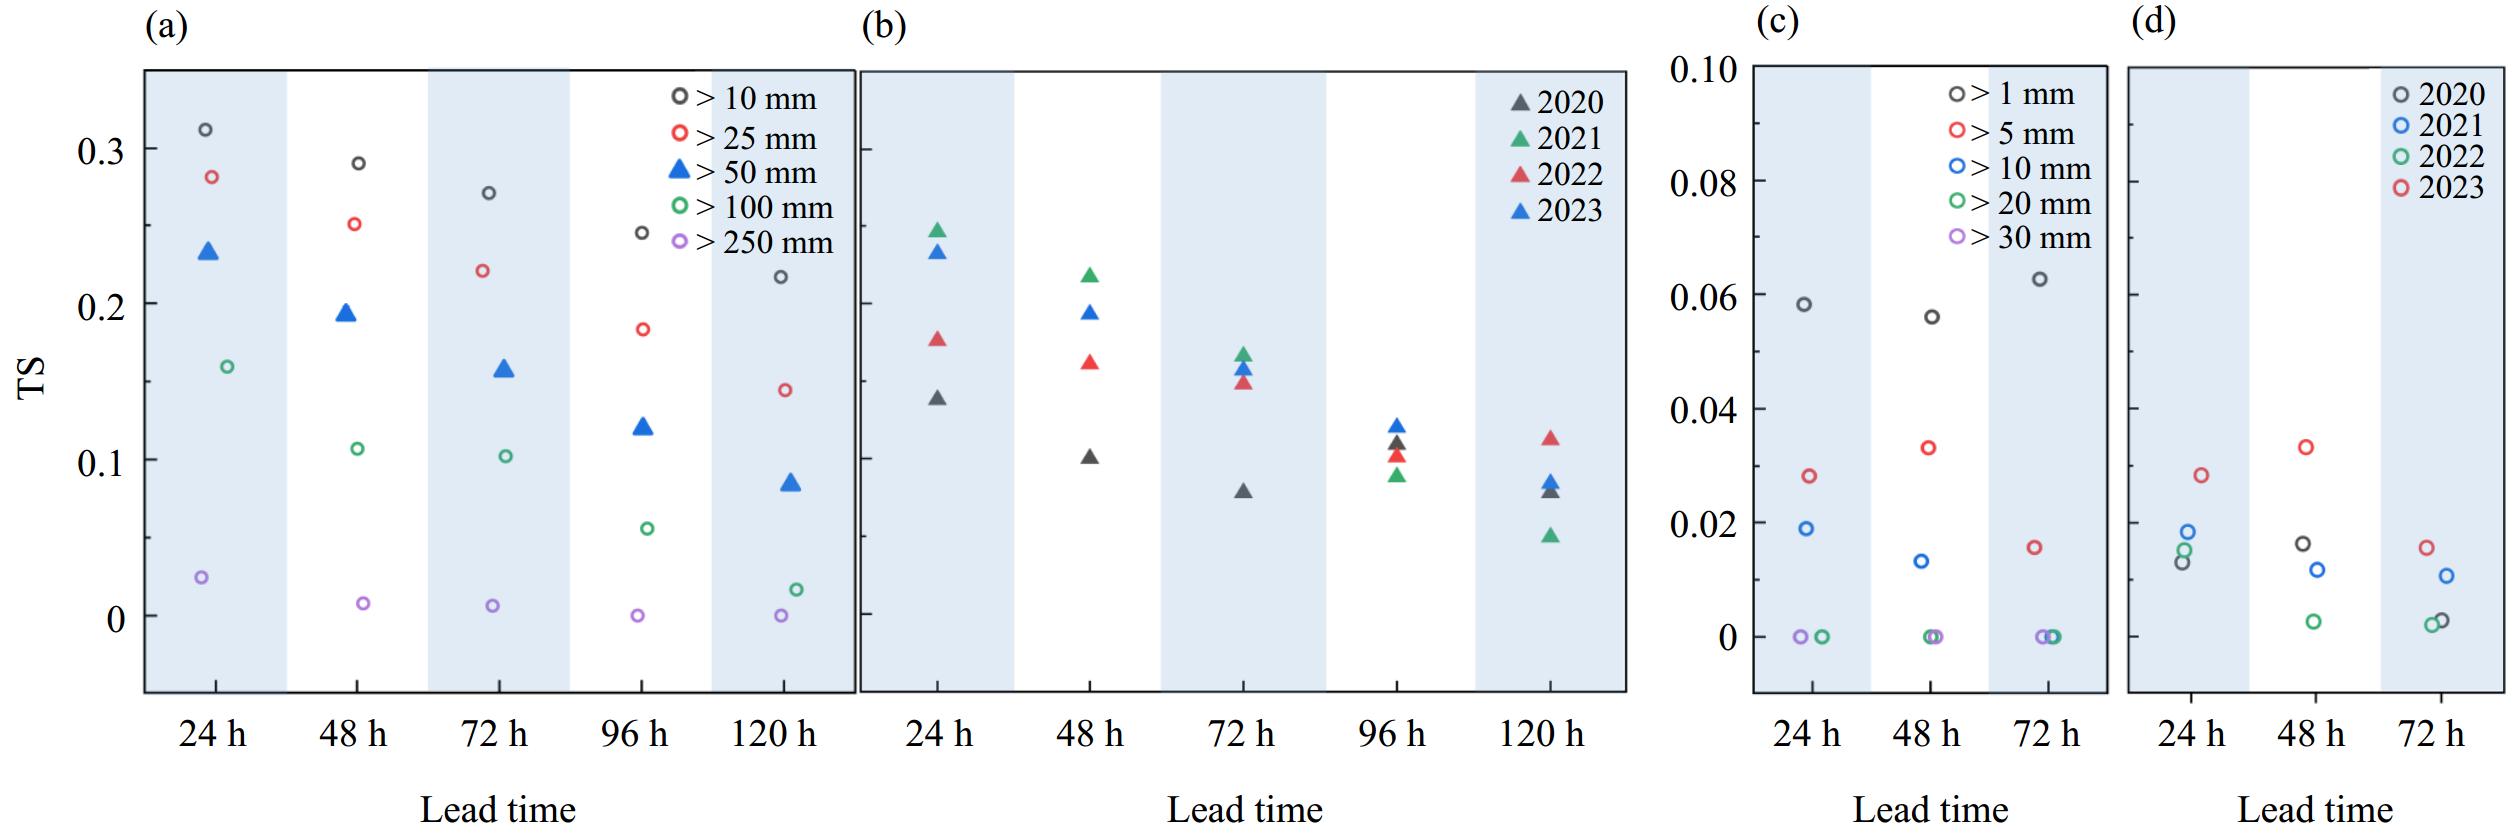
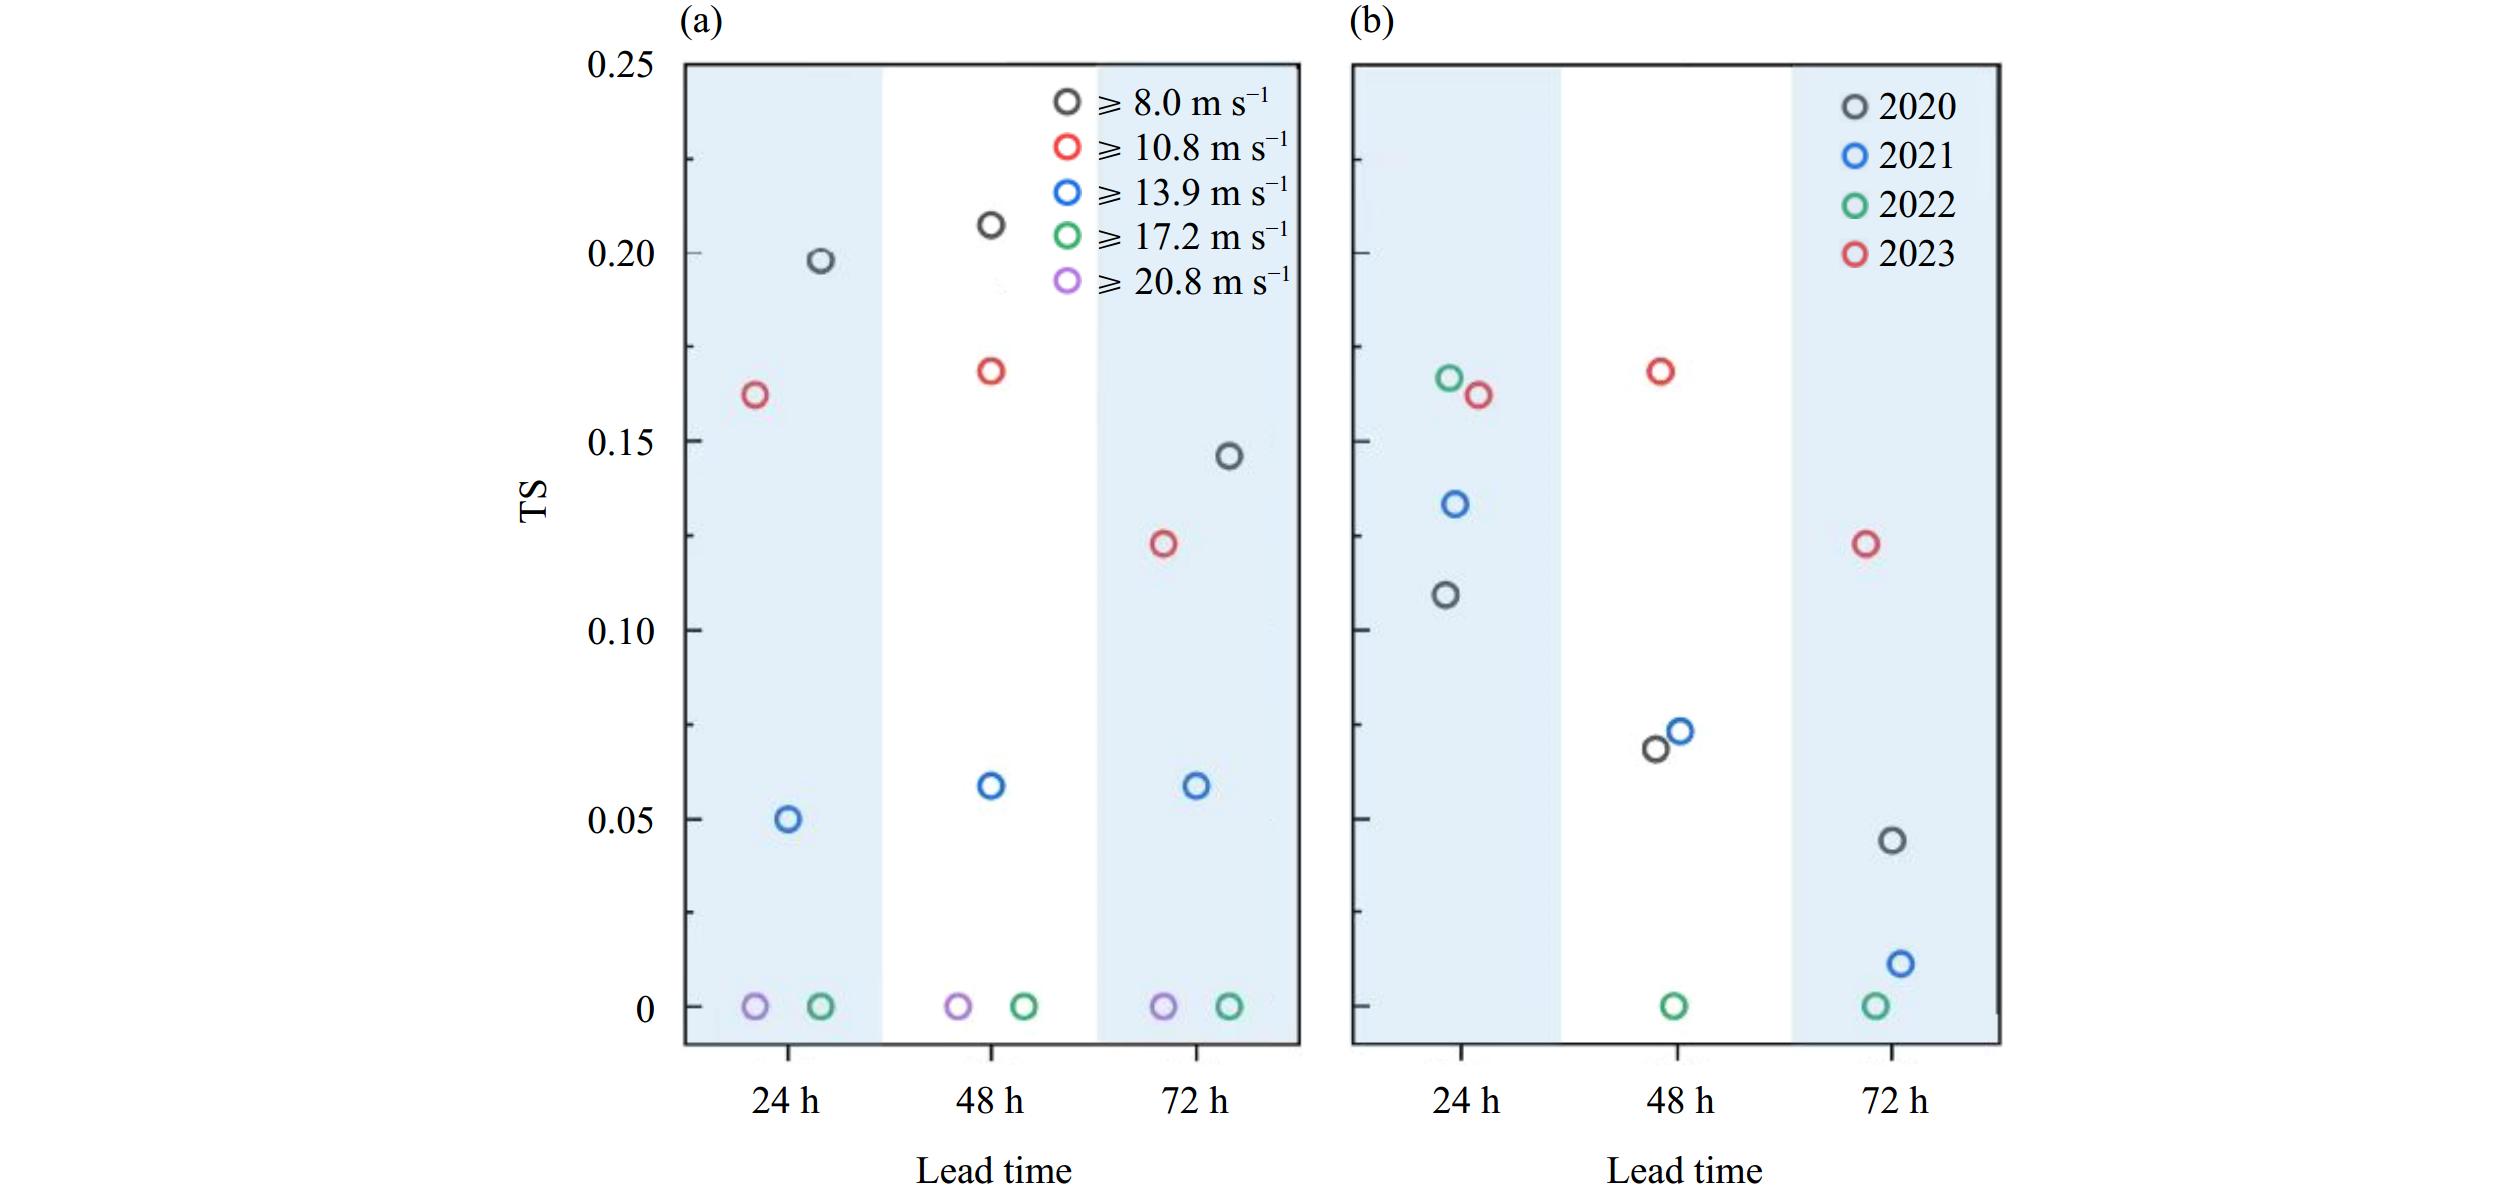
CMA’s Intelligent Grid Forecasting was employed to evaluate TC-induced precipitation and wind forecasting capabilities. Results from 2023, as illustrated in Fig. 3a, showcased a decline in the Threat Score (TS) for daily precipitation forecasts with increasing lead time and precipitation intensity. Notably, the TS for TC-induced heavy rainfall (exceeding 50 mm of daily accumulated precipitation) was 0.23 at 24 h and dipped below 0.1 at 120 h. Considering a TS above 0.1 as the benchmark for a practical forecast, this technique offered practical forecasts for extreme rainfall (exceeding 100 mm of daily accumulated precipitation) up to 72 h in advance but was inadequate for very heavy rainfall. Fixed-point quantitative forecasting of hourly rainfall intensity remained insufficient (depicted in Fig. 3c), with TS scores for precipitation exceeding 5 mm not surpassing 0.04 within 72 h, and lacking forecasting capability for precipitation over 20 mm (scoring a TS of 0). For winds surpassing force 6 on the Beaufort scale, the TS values were 0.16, 0.17, and 0.13 at 24, 48, and 72 h, respectively (as shown in Fig. 4a). However, forecasts for winds of force 7 and above were impractical, with TS scores falling below 0.1 across all lead times. Over the last four years (Fig. 3b, 3d, and 4b), daily heavy rainfall forecasts, hourly rainfall intensity forecasts, and wind forecasts exhibited an overall positive trend of improvement, albeit with notable interannual variability.
Fig
3.
The TS score of CMA’s Intelligent Grid Forecast System for TC precipitation forecasts. (a) TS scores for daily precipitation forecasts at each forecast lead time (horizontal axis) in 2023, with different colors representing different precipitation grades. (b) Same as (a), but for annual TS scores for heavy precipitation forecasts from 2020 to 2023. (c), (d) Same as (a), (b), respectively, but for TS scores for hourly precipitation forecasts, (d) TS scores for hourly precipitation (≥ 5 mm/h) forecasts from 2020 to 2023.
Fig
4.
The TS score of CMA’s Intelligent Grid Forecast System for TC hourly maximum wind speed forecasts. (a) TS scores for maximum wind speed forecasts at each forecast lead time (horizontal axis) in 2023, with different colors representing different wind speed grades. (b) Same as (a), but for annual TS scores for gale (≥ 10.8 m s−1) forecasts from 2020 to 2023.
4.
Future Prospects
Over the past century, driven by a series of domestic and international open cooperation initiatives, the development of TC forecasting technology in China has undergone major stages, including cloud observation for weather forecasting, synoptic chart analysis, statistical forecasting, statistical–dynamic forecasting, numerical forecasting, and its integrated applications. Especially since the rapid development of numerical weather forecasting in the 2000s, China’s TC forecasting capabilities have made significant progress as represented by the capabilities of CMA. However, there are still considerable weaknesses in forecasting capabilities covering the entire lifecycle of TCs. These include: the maximum 24-h forecast error for tracks is still close to 200 km, with the average 120-h track forecast error exceeding 350 km and extreme values reaching nearly 1000 km; operational capability for track forecasts beyond 5 days is not yet available; stable and effective objective forecasting methods and products are lacking for predicting TC genesis, rapid intensity changes, fine structures, wind and rainfall intensities and distributions, and disaster impacts. In recent years, consecutive post-dissipation torrential rain disasters induced by TCs, such as Doksuri in 2023 and Gaemi in 2024, have urgently necessitated improvements in forecasting and warning capabilities for hazards induced by TC remnants.
The accuracy of TC forecasts is determined by three main factors (Chen, 2021): the quality of initial values, the quality of the forecasting method itself, and the stability of atmospheric circulation. The continuous accumulation of observational data, deepening theoretical understanding, and rapid advancements in computational and information technologies are all indispensable for further enhancing TC forecasting capabilities.
Currently, the temporal resolution of infrared, visible, and water vapor remote sensing detections by China’s Fengyun series of geostationary meteorological satellites has improved from 1 h per observation in 2005 to as fast as 1 min per observation, with a maximum spatial resolution of up to 250 m. Polar-orbiting meteorological satellites now possess the capability for three-dimensional observations of TC clouds, rain, dynamical fields, and thermodynamic fields, and can carry out encrypted observations with multiple payloads working in coordination for specific TC research or operational objectives. For offshore and landing TC observations, the construction of ground-based meteorological radar networks and wind profiler networks has been continuously improved, and testing of new technologies such as lidar and quantum measurement has been initiated. The construction of mobile observation platforms such as aircraft and vessels has also begun to bear fruit. These enhancements in remote sensing and direct detection capabilities will provide us with more accurate information on TC location, intensity, and structure, and offer richer and more effective data sources for improving the initial conditions of TC models. These data will also help deepen our understanding of key processes such as the boundary layer and cloud and rain microphysics under extreme wind and rain conditions in TCs, and promote the development of physical process parameterization schemes for high-resolution TC models.
The release of the Pangu Weather AI large model in 2022 brought a significant impact on global weather forecasting. Subsequently, other meteorological AI large models such as Fengwu, Fuxi, and Fengqing were also released. Evaluations indicate that these meteorological AI large models have advantages in improving long-term TC track forecasting capabilities compared to numerical weather prediction models. This technological advancement promises to help us break through the previous two-decade bottleneck where the growth rate of TC track forecasting errors with forecasting lead times consistently failed to improve. However, as data-driven technologies, meteorological AI large models cannot overcome the limitations of their modeling data, thus demonstrating notable deficiencies in TC intensity and structure forecasting capabilities. In response to this issue, Chinese researchers have proposed a new generation of TC forecasting frameworks that integrate machine learning models with physical models (Liu et al., 2024), combining the advantages of meteorological AI large models in track forecasting with the advantages of high-resolution numerical weather prediction models in intensity and structure forecasting. Case studies have demonstrated the significant potential to extend the effective lead time for intensity and structure forecasting to over 7 days.
Beyond meteorological AI large models, AI technology has been increasingly applied in studies such as TC structure inversion based on remote sensing observations (Lu et al., 2022; Niu and Zou, 2024), the development of parameterized schemes for physical processes in TC models (Wang and Tan, 2023), and individual predictions of TC characteristics (Dong et al., 2022), showing significant advantages in improving accuracy compared to traditional linear statistical methods. With the enhancement of observation capabilities and the advancement of numerical weather prediction technology into the kilometer-to-sub-kilometer resolution stage, on the one hand, AI technology will promote the further development of high-spatiotemporal-resolution TC data assimilation and parameterized schemes for physical processes in models, and on the other hand, high-resolution numerical weather prediction technology will provide AI models with higher-quality modeling data. Therefore, it is anticipated that the integration of deepened understanding of physical laws and the development of AI technology will be an effective way to further enhance TC forecasting capabilities, with the potential to break through bottlenecks in fine-structure forecasting and long-term forecasting.
With the rapid development of economic and social activities in China, such as ocean shipping, there is an urgent need to enhance monitoring, forecasting, and service capabilities for global TCs. To address this demand, CMA has been issuing global TC monitoring bulletins since 2022, after publishing its first evaluation report on global TC forecasting in 2019. These activities are still in their infancy, and scientific and technological support for global TC monitoring, forecasting, and service needs remains insufficient and urgently needs strengthening. In addition, whether TC forecasting can be combined with the development of artificial intervention techniques for weather to enhance humanity’s response capabilities to harness TCs’ benefits and avoid their harms is receiving renewed attention from researchers (Lei, 2024). Whether the exploration of this type of question will bring revolutions to the development of TC forecasting technology warrants further discussion.
Acknowledgments
We thank Dr Dai Kan and Dr Tang Jian from the National Meteorological Centre of CMA for providing Intelligent Grid Forecast System data for this study.
Fig.
1.
Annual track forecast errors of CMA (1990–2023). The solid lines represent the annual mean position errors, the dashed lines represent the 75th percentile of the position errors, and the table below shows the 95th percentile of the position errors (km; different colors represent different forecast lead times).
Fig.
2.
Annual intensity forecast errors of CMA (2004–2023). The lower graph shows the mean absolute errors, the upper graph shows the 75th percentile of the absolute errors, and the lower table shows the 95th percentile of the absolute errors (m s−1. Different colors represent different forecast lead times).
Fig.
3.
The TS score of CMA’s Intelligent Grid Forecast System for TC precipitation forecasts. (a) TS scores for daily precipitation forecasts at each forecast lead time (horizontal axis) in 2023, with different colors representing different precipitation grades. (b) Same as (a), but for annual TS scores for heavy precipitation forecasts from 2020 to 2023. (c), (d) Same as (a), (b), respectively, but for TS scores for hourly precipitation forecasts, (d) TS scores for hourly precipitation (≥ 5 mm/h) forecasts from 2020 to 2023.
Fig.
4.
The TS score of CMA’s Intelligent Grid Forecast System for TC hourly maximum wind speed forecasts. (a) TS scores for maximum wind speed forecasts at each forecast lead time (horizontal axis) in 2023, with different colors representing different wind speed grades. (b) Same as (a), but for annual TS scores for gale (≥ 10.8 m s−1) forecasts from 2020 to 2023.
Chen, L. S., 2021: Seventy years of development in typhoon forecasting and scientific research in China. Abstract Collection of 19th National Workshop on Tropical Cyclones (NWTC-XIX). Qingdao, Shandong, 24–26 May, Shanghai Typhoon Institute of China Meteorological Administration, 1–5. Available online at https://www.sti.org.cn/uploads/20240829/674b05f5f171baf8b58b40cc38441225.pdf. Accessed on 6 May 2025. (in Chinese)
Chen, Z. T., D. S. Xu., G. F. Dai, et al., 2020: Technical scheme and operational system of tropical high-resolution model (TRAMS-V3.0). J. Trop. Meteor., 36, 444–454, https://doi.org/10.16032/j.issn.1004-4965.2020.041. (in Chinese)
China Meteorological Administration, 1991: Regulations on Typhoon Operations and Services (First Revision). China Meteorological Press, Beijing, 6–4. (in Chinese)
China Meteorological Administration, 1997: Regulations on Typhoon Operations and Services (Second Revision). China Meteorological Press, Beijing, 43–44. (in Chinese)
China Meteorological Administration, 2001: Regulations on Typhoon Operations and Services (Third Revision). China Meteorological Press, Beijing, 43–44. (in Chinese)
China Meteorological Administration, 2012: Regulations on Typhoon Operations and Services (Fourth Revision). China Meteorological Press, Beijing, 33–34. (in Chinese)
Dong, K. Q., Q. L. Zheng, W. P. Zhang, et al., 1974: An improved method for forecasting typhoon track with steering flow. Proceedings of the Conference on Numerical Forecasting and Mathematical Statistical Forecasting, Central Weather Bureau Meteorological Science Research Institute, Ed., Science Press, Beijing, 57–59. (in Chinese)
Dong, P. P., J. Lian, H. Yu, et al., 2022: Tropical cyclone track prediction with an encoding-to-forecasting deep learning model. Wea. Forecasting, 37, 971–987, https://doi.org/10.1175/waf-d-21-0116.1.
Duan, Y. H., Q. L. Wan, J. Huang, et al., 2019: Landfalling tropical cyclone research project (LTCRP) in China. Bull. Amer. Meteor. Soc., 100, ES447–ES472, https://doi.org/10.1175/BAMS-D-18-0241.1.
Fei, L., Y. M. Xu, and X. T. Lei, 1999: The operation and research on anomalous movement of tropical cyclones in China. Atmos. Sci. Res. Appl., 1, 114–125. (in Chinese)
Gu, J. F., X. A. Jiang, H. B. Yin, et al., 2000: The operational prediction results of the East China Sea tropical cyclone model and improvement of the model. J. Trop. Meteor., 16, 54–61, https://doi.org/10.3969/j.issn.1004-4965.2000.01.007. (in Chinese)
Guo, R., H. Yu, L. B. Qi, et al., 2019: A study on multi-model ensemble forecast technique for typhoon track. J. Meteor. Sci., 39, 839–846, https://doi.org/10.3969/2018jms.0090. (in Chinese)
Guo, Y. R., 1983: An improved operational typhoon track forecasting model. Proceedings of the 1981 Typhoon Conference, National Typhoon Research Collaboration Technical Group, Ed., Shanghai Scientific & Technical Publishers, Shanghai, 289–292. (in Chinese)
Huang, W., and X. D. Liang, 2010: A cycling typhoon like vortex initialization scheme and its application to GRAPES-TCM. Acta Meteor. Sinica, 68, 365–375, https://doi.org/10.11676/qxxb2010.036. (in Chinese)
Huang, W., Y. H. Duan, J. S. Xue, et al., 2007: Operational experiments and its performance analysis of the tropical cyclone numerical model (GRAPES_TCM). Acta Meteor. Sinica, 65, 578–587, https://doi.org/10.11676/qxxb2007.053. (in Chinese)
Huang, W., H. Yu, and X. D. Liang, 2009: Evaluation of GRAPES-TCM rainfall forecast for China landfalling tropical cyclone. Acta Meteor. Sinica, 67, 892–901, https://doi.org/10.11676/qxxb2009.087. (in Chinese)
Huang, X., 1928: Experience with three years of hurricanes. J. Chinese Meteor. Soc., 4, 33–44. (in Chinese)
Jiang, B. R., 1936: Overview of China’s meteorological undertakings in the past 20 years. Sci., 20, 623–642. (in Chinese)
Jin, Y. M., J. X. Cai, and N. S. Liu, 1983: Climatology and persistence (Cliper) track forecast method for typhoons in the second cordon. Proceedings of the 1981 Typhoon Conference, National Typhoon Research Collaboration Technical Group, Ed., Shanghai Scientific & Technical Publishers, Shanghai, 55–60. (in Chinese)
Lei, X. T., 2020: Overview of the development history of China’s typhoon research and operational work in the past century. Sci. China Earth Sci., 63, 362–383, https://doi.org/10.1007/s11430-018-9379-8.
Lei, X. T., 2024: Challenges and countermeasures in the development of typhoon discipline in China. Anthology of 100 Years of Atmos. Sci. Res. Appl. Prog., Chinese Meteor. Soc., 669–678 (in Chinese)
Li, H., J. Y. Luo, and M. T. Xu, 2019: Ensemble data assimilation and prediction of typhoon and associated hazards using TEDAPS: Evaluation for 2015–2018 seasons. Front. Earth Sci., 13, 733–743, https://doi.org/10.1007/s11707-019-0794-4.
Liang, X. D., B. Wang, J. C. L. Chan, et al., 2007a: Tropical cyclone forecasting with model-constrained 3D-Var. I: Description. Quart. J. Roy. Meteor. Soc., 133, 147–153, https://doi.org/10.1002/qj.9.
Liang, X. D., B. Wang, J. C. L. Chan, et al., 2007b: Tropical cyclone forecasting with model-constrained 3D-Var. II: Improved cyclone track forecasting using AMSU-A, QuikSCAT and cloud-drift wind data. Quart. J. Roy. Meteor. Soc., 133, 155–165, https://doi.org/10.1002/qj.10.
Liu, H. Y., Z. M. Tan, Y. Q. Wang, et al., 2024: A hybrid machine learning/physics-based modeling framework for 2-week extended prediction of tropical cyclones. J. Geophys. Res. Mach. Learn. Comput., 1, 2024JH000207, https://doi.org/10.1029/2024jh000207.
Lu, W., 1935: Typhoons that made landfall in July last year. J. Chinese Meteor. Soc., Ten Years Commemorative Issue, 1–17. (in Chinese)
Lu, X. Q., W. K. Wong, H. Yu, et al., 2022: Tropical cyclone size identification over the western North Pacific using support vector machine and general regression neural network. J. Meteor. Soc. Japan, 100, 927–941, https://doi.org/10.2151/jmsj.2022-048.
Luo, J. Y., H. Li, M. Xue, et al., 2022: Direct assimilation of radar reflectivity data using ensemble Kalman filter based on a two-moment microphysics scheme for the analysis and forecast of typhoon Lekima (2019). Remote Sens., 14, 3987, https://doi.org/10.3390/rs14163987.
Ma, L. M., 2014: Research progress on China typhoon numerical prediction models and associated major techniques. Prog. Geophys., 29, 1013–1022, https://doi.org/10.6038/pg20140305. (in Chinese)
Ma, L. M., and Z. M. Tan, 2009: Improving the behavior of the cumulus parameterization for tropical cyclone prediction: Convection trigger. Atmos. Res., 92, 190–211, https://doi.org/10.1016/j.atmosres.2008.09.022.
Ma, L. M., and X. W. Bao, 2016: Parametrization of planetary boundary-layer height with helicity and verification with tropical cyclone prediction. Bound.-Layer Meteor., 160, 569–593, https://doi.org/10.1007/s10546-016-0156-7.
Ma, S. H., J. Zhang, X. S. Shen, et al., 2018: The upgrade of GRAPE_TYM in 2016 and its impacts on tropical cyclone prediction. J. Appl. Meteor. Sci., 29, 257–269, https://doi.org/10.11898/1001-7313.20180301. (in Chinese)
Ma, S. H., J. Zhang, A. X. Qu, et al., 2021: Impacts to tropical cyclone prediction of GRAPES_TYM from increasing of model vertical levels and enlargement of model forecast domain. Acta Meteor. Sinica, 79, 94–103, https://doi.org/10.11676/qxxb2020.067. (in Chinese)
Ni, Y. Q., Z. Y. Xue, H. L. Jin, 1980: The [77] scheme for numerical typhoon track forecasting in the Western Pacific and its experimental results. Proceedings of the Second National Conference on Numerical Weather Prediction, Central Weather Bureau Meteorological Science Research Institute, Ed., Science Press, Beijing, 137–149. (in Chinese)
Niu, Z. Y., and X. L. Zou, 2024: A machine learning approach for deriving atmospheric temperatures and typhoon warm cores from FY-3E MWTS-3 observations. J. Geophys. Res. Mach. Learn. Comput., 1, e2024JH000170, https://doi.org/10.1029/2024jh000170.
Qi, L. B., H. Yu, and P. Y. Chen, 2014: Selective ensemble-mean technique for tropical cyclone track forecast by using ensemble prediction systems. Quart. J. Roy. Meteor. Soc., 140, 805–813, https://doi.org/10.1002/qj.2196.
Qian, Q. F., C. A. Zhang, S. Z. Gao, et al., 2014: Real-time correction method for ensemble forecasting of typhoon tracks. J. Trop. Meteor., 30, 905–910, https://doi.org/10.3969/j.issn.1004-4965.2014.05.010. (in Chinese)
Shanghai Typhoon Collaborative Group, 1975: A statistical–dynamical method for typhoon track forecast in the Western Pacific. Proceedings of the 1974 Typhoon Conference, Technical Group of the National Typhoon Joint Prevention and Scientific Research Cooperation Conference, Ed., Shanghai People’s Publishing House Co., Ltd., Shanghai, 76–82. (in Chinese)
Shanghai Typhoon Institute of China Meteorological Administration, 2024: Evaluation of typhoon forecasting in the western North Pacific and the South China Sea in 2023. The Second Meeting of the 10th National Working Group of Typhoon and Marine Meteorological Experts, Quanzhou, Fujian, 21–22 March, http://116.62.195.108/STI_IBF/Page/ch/jybg.html. Accessed on 20 May 2025. (in Chinese)
Shantou Meteorological Observatory, Guangdong Province, 1975: Integrated typhoon forecasting methodology. Proceedings of the 1974 Typhoon Conference, Ed., Shanghai People’s Publishing House Co., Ltd., Shanghai, 217–221. (in Chinese)
Shu, J. X., and Z. L. Wang, 1983: Research progress on typhoon in China for last ten years. Proceedings of the 1981 Typhoon Conference, National Typhoon Research Collaboration Technical Group, Ed., Shanghai Scientific & Technical Publishers, Shanghai, 1–14. (in Chinese)
Wang, D. L., X. D. Liang, and Y. H. Duan, 2005: Impact of four dimensional variational data assimilation of the cloud drift wind data on tropical cyclone track numerical forecast. Acta Meteor. Sinica, 63, 351–358, https://doi.org/10.11676/qxxb2005.035. (in Chinese)
Wang, D. L., X. D. Liang, Y. Zhao, et al., 2008: A comparison of two tropical cyclone bogussing schemes. Wea. Forecasting, 23, 194–204, https://doi.org/10.1175/2007waf2006094.1.
Wang, D. W., and Z. C. Piao, 1981: Numerical typhoon track forecast model LN-1. Proceedings of the 1978 Typhoon Conference, Shanghai People’s Publishing House Co., Ltd, Shanghai, 1–7. (in Chinese)
Wang, D. W., and Z. C. Piao, 1983: Preliminary experiment of a movable nested mesh model for typhoon track forecasting. Acta Meteor. Sinica, 41, 115–120, https://doi.org/10.11676/qxxb1983.013. (in Chinese)
Wang, K. L., A. G. He, and J. S. Xue, 1996: Preliminary test of typhoon trace numerical prediction for the South China Sea area. J. Trop. Meteor., 12, 113–120. (in Chinese)
Wang, L. Y., and Z. M. Tan, 2023: Deep learning parameterization of the tropical cyclone boundary layer. J. Adv. Model. Earth Syst., 15, e2022MS003034, https://doi.org/10.1029/2022MS003034.
Wang, S. W., and J. J. Li, 1994: Experiments of real time numerical weather prediction of typhoon tracks. Quart. J. Appl. Meteor., 5, 462–469. (in Chinese)
Wang, Y. W., 1918a: Talking about typhoons. Meteor. Obs. Reposit., 4, 21–24. (in Chinese)
Wang, Y. W., 1918b: Talking about typhoons. Meteor. Obs. Reposit., 4, 27–34. (in Chinese)
Wang, Y. W., 1918c: Talking about typhoons. Meteor. Obs. Reposit., 4, 17–32. (in Chinese)
Wang, Y. W., 1918d: Talking about typhoons. Meteor. Obs. Reposit., 4, 21–42. (in Chinese)
Wang, Y. W., 1919a: Talking about typhoons. Meteor. Obs. Reposit., 5, 1–26. (in Chinese)
Wang, Y. W., 1919b: Talking about typhoons. Meteor. Obs. Reposit., 5, 11–42. (in Chinese)
Wang, Z. L., and B. C. Luan, 1964: Medium-range typhoon track forecasting procedure in the Western Pacific. Meteor. Commun, Issue (6), 38–43. (in Chinese)
Yu, H., G. M. Chen, C. Zhou, et al., 2022: Are we reaching the limit of tropical cyclone track predictability in the western North Pacific. Bull. Amer. Meteor. Soc., 103, E410–E428, https://doi.org/10.1175/bams-d-20-0308.1.
Yu, H., G. M. Chen, W. K. Wong, et al., 2024: WMO Typhoon Landfall Forecast Demonstration Project (2010–22): A decade of transition from track forecasts to impact forecasts. Bull. Amer. Meteor. Soc., 105, E1320–E1349, https://doi.org/10.1175/bams-d-23-0085.1.
Zhang, J., H. Li, W. S. Duan, et al., 2022: Review on the research progress of typhoon ensemble forecast. Trans. Atmos. Sci., 45, 713–727, https://doi.org/10.13878/j.cnki.dqkxxb.20211124001. (in Chinese)
Zhang, X., J. W. Bao, B. D. Chen, et al., 2018: A three-dimensional scale-adaptive turbulent kinetic energy scheme in the WRF-ARW model. Mon. Wea. Rev., 146, 2023–2045, https://doi.org/10.1175/mwr-d-17-0356.1.
Zhang, X., J. W. Bao, W. Huang, et al. 2023: Statistics of the subgrid cloud of an idealized tropical cyclone at convection-permitting resolution. J. Adv. Model. Earth Syst., 15, e2022MS003534, https://doi.org/10.1029/2022MS003534.
Zhang, X. B., 2018: A GRAPES-based mesoscale ensemble prediction system for tropical cyclone forecasting: Configuration and performance. Quart. J. Roy. Meteor. Soc., 144, 478–498, https://doi.org/10.1002/qj.3220.
Zheng, Y. X., W. Huang, and R. L. Yu, 2015: A regional coupled air-sea-wave model: Simulation of upper-ocean responses to an idealized tropical cyclone. J. Trop. Meteor., 21, 232–245, https://doi.org/10.16555/j.1006-8775.2015.03.003.
Zhou, G. B., J. Xu, Q. F. Qian, et al., 2022: Discriminating technique of typhoon rapid intensification trend based on artificial intelligence. Atmosphere, 13, 448, https://doi.org/10.3390/atmos13030448.
Zhou, L., D. K. Chen, X. T. Lei, et al., 2019: Progress and perspective on interactions between ocean and typhoon. Chinese Sci. Bull., 64, 60–72, https://doi.org/10.1360/N972018-00668. (in Chinese)
Zhou, X. Q., Y. H. Duan, and Y. T. Zhu, 2003: The ensemble forecasting of tropical cyclone motion Ⅰ: Using a primitive equation barotropic model. J. Trop. Meteor., 19, 1–8. (in Chinese)
Zhu, X. S., W. Huang, H. Yu, et al., 2024: Scale-adaptive physical process parameterization scheme for typhoon forecasting and its configuration preference. Anthology of 100 Years of Atmos. Sci. Res. Appl. Prog., Chinese Meteor. Soc., 735–750. (in Chinese)
Zhu, Y. T., Y. M. Xu, F. Q. Hu, et al., 1982: An experiment in numerical forecasting of typhoon tracks with nested models. Acta Meteor. Sinica, 40, 257–270, https://doi.org/10.11676/qxxb1982.027. (in Chinese)
Yu H., L. S. Chen, Z. M. Tan, et al., 2025: Development of tropical cyclone forecasting technology in China: the history, present situation and future. J. Meteor. Res., 39(3), 1–13, https://doi.org/10.1007/s13351-025-4910-y.
Yu H., L. S. Chen, Z. M. Tan, et al., 2025: Development of tropical cyclone forecasting technology in China: the history, present situation and future. J. Meteor. Res., 39(3), 1–13, https://doi.org/10.1007/s13351-025-4910-y.
Yu H., L. S. Chen, Z. M. Tan, et al., 2025: Development of tropical cyclone forecasting technology in China: the history, present situation and future. J. Meteor. Res., 39(3), 1–13, https://doi.org/10.1007/s13351-025-4910-y.
Citation:
Yu H., L. S. Chen, Z. M. Tan, et al., 2025: Development of tropical cyclone forecasting technology in China: the history, present situation and future. J. Meteor. Res., 39(3), 1–13, https://doi.org/10.1007/s13351-025-4910-y.
Export: BibTexEndNote
Article Metrics
Article views: 34 PDF downloads: 6Cited by:
Manuscript History
Received: 07 October 2024
Available online: 14 April 2025
Typeset Proofs: 15 April 2025
Issue in Progress: 29 April 2025
Share
Catalog
Abstract
摘要
1.
Introduction
2.
Main developmental stages of TC forecast technology in China in the past hundred years
2.1
1910s–1940s: the start and widespread application stage of weather map analysis
2.2
1950s–1960s: semi-objective synoptic method development stage
2.3
1970s–1990s: widespread adoption of objective statistical forecasting methods and nascent tage of numerical forecasting technology
2.4
2000s to now: a stage of rapid development and integrated application for TC numerical prediction technology


 DownLoad: