Dust aerosols profoundly influence the radiative balance of the earth–atmosphere system and hence the global and regional climates. In this study, using multi-source satellite and ground-level observations combined with meteorological data, we investigated the three-dimensional evolution and transport characteristics of aerosols during a dust event that occurred in Xinjiang, China from 19 to 21 March 2019. Analysis of the meteorological data reveals that the dust air mass initially appeared in the northwest of Xinjiang and was subsequently transported to the Hami and Turpan areas due to the prevailing northwesterly winds, after which the direction of the airflow shifted due to topography, and the dust air masses were transported into southern Xinjiang. The air quality in the affected areas decreased rapidly, accompanied by a significant increase in aerosol optical depth (AOD), with the maximum value exceeding 3.5 in some areas. In addition, the Cloud–Aerosol Lidar and Infrared Pathfinder Satellite Observations (CALIPSO) data reveal that the aerosol particles in the dust-affected areas were mainly dust aerosols, with small amounts of pollutant dust aerosols. A reduction in the attenuated backscatter coefficient (β532||) was found with increasing altitude, with the dust aerosol pollution mainly distributed in the lower troposphere. The size of dust particles in the lower troposphere was relatively small and irregular. The depolarization ratio (PDR) values at altitudes of 8–10 km were relatively lower than those recorded in the lower troposphere, whereas the color ratio (CR) values were higher, which may have been influenced by the sparse vegetation coverage and poor subsurface conditions in Xinjiang, and attributable to the fact that regular large particles of dust are more likely to be dispersed to altitudes between 8 and 10 km within a short period of time. As a consequence of the meteorological conditions and topography, the dusting process in Xinjiang persisted for a relatively long period. These findings will contribute to enhanced understanding of the vertical distribution of aerosols in Northwest China.
As a major component of the atmosphere, the atmospheric aerosol is a general term for a heterogeneous system of suspended solid and liquid particles that have only one-billionth of the mass of the atmosphere. Aerosols affect the local and even global climates, by directly or indirectly influencing the energy balance of the earth–atmosphere system, and they can also be detrimental to human health through carrying deleterious substances (Takamura et al., 2007; Perrone et al., 2015; Fernández et al., 2017; Jia et al., 2018; Huige et al., 2021).
Dust is an important component of atmospheric aerosols (Han et al., 2004; Mahowald et al., 2014). It is estimated that approximately 2000 tons of dust are released into the atmosphere each year (Ginoux et al., 2004). Dust plays a role in a range of cycling processes of the earth system (Shao et al., 2011; Alizadeh-Choobari et al., 2014; Yang et al., 2020) and directly affects the global energy budget (Bi et al., 2016, 2017; Kok et al., 2017). The vertical distribution of dust aerosols can have a significant influence on the atmospheric energy balance and surface temperature/precipitation processes, and the direct and indirect radiative effects of aerosols are also highly dependent on their vertical distribution. The vertical structure of aerosols is a key parameter in assessing the thermal structure of the atmosphere and is of particular importance for accurate estimates of the radiative effects of aerosols (Samset et al., 2013; Marinescu et al., 2017). Moreover, gaining an understanding of the verti-cal distribution of dust aerosols and accurately identifying the sources of dust contribute to better assessment of the effects of dust on air quality, human health, and climate change (De Longueville et al., 2010; Behzad et al., 2018; Querol et al., 2019; Sarkar et al., 2019).
Globally, dust sources are broadly distributed, mainly across arid and semiarid regions, where loose surface soils and sparse vegetation provide the basis for a rich source of materials for dust formation. Typical dust source areas, such as the Sahara desert, the Middle East, central Asia, North America, and Australia, release hundreds of millions of tons of dust into the atmosphere (Liu et al., 2020; Chen et al., 2021). In China, the region of Xinjiang is recognized as one of the major dust source areas in central Asia, characterized by an arid climate, low precipitation, sparse vegetation, and strong winds, and is extremely susceptible to surface wind erosion, resulting in frequent dust activities. Consequently, this region is an important natural source of dust emission in not only China but also the world (Shen et al., 2020). It is thus essential to study the spatial distribution characteri-stics of dust aerosols in the Xinjiang region.
Xinjiang has been surveyed in many previous studies focusing on dust aerosols, most of which were based on traditional meteorological observations and passive satellite remote sensing monitoring, including Moderate Reso-lution Imaging Spectroradiometer (MODIS), Multiangle Imaging Spectroradiometer (MISR), Total Ozone Mapping Spectrometer (TOMS), and so on (Qi et al., 2013; Di et al., 2016; Kang et al., 2017; Wang et al., 2019; Li et al., 2021). Although remote sensing data provide good coverage of the horizontal distribution and transport of dust aerosols, they cannot provide information on the vertical distribution of aerosols. In contrast, the Cloud–Aerosol Lidar and Infrared Pathfinder Satellite Observations (CALIPSO) satellite launched on 28 April 2016 can effectively detect aerosols over the bright surfaces and provide data on the vertical structure of aerosols and clouds globally, which is of considerable significance for our understanding of the vertical distribution and radia-tive effects of dust aerosols (Winker et al., 2003; Zhang et al., 2021). For example, a number of studies have used CALIPSO data and other data to investigate the seasonal distribution and three-dimensional structure of different types of aerosols in certain regions (Adams et al., 2012; Liu et al., 2012; Ge et al., 2014; Xu et al., 2020; Liao et al., 2021), whereas others have used CALIPSO data to estimate the radiative effects of aerosols in the study area (Jia et al., 2018; Wang et al., 2022). So far, a wide range of studies have been conducted based on the CALIPSO satellite data.
To date, however, there have been relatively few studies examining the vertical distribution characteristics of aerosols in the Xinjiang region based on the CALIPSO data. This deficiency in studying the vertical characteristics of aerosols in Xinjiang not only hinders our understanding of aerosols in the dust source regions of central Asia but also hampers assessments of global climate. Xinjiang is a comparatively poorly sampled and less studied region in China. In order to gain further information on the vertical distribution of aerosols in this region, we focus on a dust storm event that occurred from 19 to 21 March 2019. Satellite remote-sensing data, such as MODIS and CALIPSO, along with ground environmen-tal monitoring data, will be used comprehensively to obtain aerosol optical property parameters, including particulate matter (PM) concentrations, aerosol optical depth (AOD), attenuated backscatter coefficient at 532 nm (β532||), depolarization ratio (PDR), and color ratio (CR), in the vertical direction during this dust event. These parameters are useful for analysis at multi-dimensional (temporal, horizontal, and vertical) scales.
Although there have been numerous other short-term dust storms in this region, this dust event is of particular interest, given that the effects of dust were seen over a large area and were simultaneously recorded across multiple cities (Rupakheti et al., 2021). Our objective of this study is to examine the effects of the dust event on the regional air quality and the vertical distribution characteristics of aerosols during the emission and transport processes. Our findings in this study are expected to contribute to not only quantitative assessment of air quality in the dust-affected regions, but also improved understanding of the vertical distribution of aerosols in Xinjiang of Northwest China.
2.
Data and methods
2.1
The study region
Xinjiang is the largest provincial administrative region in China, covering one-sixth of the country’s total area. It not only borders several other countries, but also represents a frontier of China’s association with central Asia and has a particular economic and strategic status, being the current core region of China’s Belt and Road Initiative (Liu et al., 2018; Jin et al., 2022). Influenced by the midlatitude westerly wind belt, it is characterized by a typical temperate continental climate. It lies deep inland, distant from the nearest ocean, with a low average annual precipitation of approximately 145 mm. Xinjiang is divided into three high-altitude mountainous regions, the Altai, Tianshan, and Kunlun mountain regions, which form a distinctive mountain–oasis–desert landscape ecosystem (Turap et al., 2019; Wang et al., 2020). With the widespread distribution of sandy deserts and gravelly Gobi deserts, dusty materials are abundant. The Xinjiang ecosystem is accordingly particularly vulnerable and exceptionally sensitive to climate variation (Zhang et al., 2017; Chen et al., 2020), and frequent dust activities have exacerbated this vulnerability and severely threa-tened the ecological security of Xinjiang.
2.2
MODIS AOD data
Aerosol products from MODIS have been in wide use since 2000, and have contributed to a considerable improvement in the remote sensing monitoring of aerosols and facilitated both regional and global large-scale monitoring of atmospheric aerosol contents. Multiangle Implementation of Atmospheric Correction (MAIAC) AOD data (MCD19A2) are a terrestrial AOD gridded level 2 product inversed with an advanced MAIAC algorithm (Levy et al., 2013; Zhang et al., 2019). The MAIAC AOD product is based on a 1-km sinusoidal grid and has been widely used by researchers to provide new long time-series datasets for aerosol monitoring on regional to global scales. Given its higher resolution, MAIAC AOD can be used to obtain better characterization of the spatial and temporal heterogeneity of aerosols (Mhawish et al., 2019; Nabavi et al., 2019). For the purposes of the present study, we selected MAIAC AOD data (https://ladsweb.modaps.eosdis.nasa.gov/) covering the entire Xinjiang region for the period of 19–24 March 2019. These data were processed by using ENVI IDL to extract AOD values at 550 nm, which were subsequently used for analysis of the spatiotemporal distribution of aerosols during the selected dust event.
2.3
Ground-based air quality
To monitor air quality in China, the Ministry of Environmental Protection of the People’s Republic of China has established 1497 air quality monitoring stations in 367 cities to collect real-time measurements of pollutants, including PM10 and PM2.5 (particulate matter with particle sizes below 10 and 2.5 μm, respectively). The concentrations of PM can serve as a reliable indicator of local atmospheric pollution status (Yin et al., 2019; Gui et al., 2020). In the present study, we focused exclusively on the Xinjiang region as a study area, wherein there are 41 ground-based monitoring stations located in 16 cities (Chen et al., 2018), the distribution of which is shown in Fig. 1. The relevant data were downloaded from the Environmental Knowledge Service System at http://envi.ckcest.cn/environment/.
Fig
1.
Location of Xinjiang and distribution of meteorological stations.
2.4
CALIPSO
CALIPSO is jointly developed by NASA and the French National Space Agency (CNRS). The CALIPSO payload comprises three instruments, among which CALIOP is a dual-wavelength polarization-sensitive lidar that provides high-resolution information on the vertical distribution of global aerosols, even against bright, dark, or uneven surfaces, and is an effective tool for studying dust aerosols (Liu Z. Y. et al., 2008). We analyzed the types of aerosols detected during the dust event using CALIPSO L2 VFM (vertical feature mask) data. The aerosol subtypes classified in CALIPSO data version 4.20 are defined as clean marine, dust, polluted continental, clean continental, polluted dust, and smoke. With the level-1B data of CALIPSO products, values can be calculated for β532||, PDR, and CR, which are used to analyze the vertical optical properties of aerosols during the dust event (Winker et al., 2007; Dong et al., 2022). Owing to the influence of daytime solar illumination, the aerosol extinction has a lower detection sensitivity during the daytime than during the night. This accordingly implies that the weak-scattering aerosol layers that are detectable at night may go undetected during the daytime, which would thus contribute to a degree of uncertainty regarding the validity of daytime observational data (Liao et al., 2021). Given this disparity, we used nighttime CALIOP data (https://search.earthdata.nasa.gov/) to investigate the distribution features of aerosols during the dusty period. β532||, PDR, and CR values are calculated with the following equations:
β532||=β532total(z)−β532⊥(z),
(1)
PDR=β532⊥(z)β532||,
(2)
CR=β1064(z)β532total(z),
(3)
where β532total(z) is the total attenuated backscattering coefficient at 532 nm, β532⊥(z) is the vertical attenuation backscattering coefficient at 532 nm, and β1064(z) is the attenuated backscattering coefficient at 1064 nm.
2.5
ERA-5 reanalysis data
The ERA-5 reanalysis data are generated by the ECMWF, which is a specialized international weather forecasting research and operating agency that periodically adopts global weather models and data assimilation systems to forecast the weather based on incoming meteorological data. ERA-5 features 137 model levels from the ground to an altitude corresponding to 0.01 hPa and has a fine horizontal resolution of approximately 31 km (Wang et al., 2015; Olauson, 2018). In this study, we use the ERA-5 hourly reanalysis data (u and v winds, tempe-rature, and geopotential height) at a resolution of 0.25° × 0.25° for analysis of the weather conditions during the dust event. The products are available at the ECWMF website (https://cds.climate.copernicus.eu/).
2.6
Back trajectory analysis
The NOAA’s Hybrid Single-Particle Lagrangian Integrated Trajectory (HYSPLIT) model (Draxler and Hess, 1998) is an important tool that can be employed to simulate the direction and path of air mass transport. Meteorological data from the Global Data Assimilation System (GDAS) are generally used as driving data for the HYSPLIT model, which can then generate forward and backward trajectories based on the starting positions (Kim et al., 2004). To determine the source of dust air masses, the period with the highest PM10 concentration is typically selected as the starting time. In this study, we calculated 72-h backward trajectories at 500-m height in the Hami and Turpan areas on 19 March, the Aksu area on 20 March, and the Hotan area on 21 March 2019.
3.
Results and analysis
3.1
Dust event identification
Under the influences of a surface cold front and the Mongolian cyclone, a widespread dust storm occurred in China from 19 to 21 March 2019. Sand or suspended dust appeared in multiple regions, including southern Xinjiang, central and western Inner Mongolia, northern Gansu, and northwestern Qinghai. In Xinjiang, the dust storm was observed in Wensu and Xinhe, and a strong dust storm was detected in parts of the southern Xinjiang basin. To assess the impact of the dusting process, we selected the MCD19A2 AOD at 550 nm before and after the occurrence of the storm, to analyze the spatiotempo-ral distribution of the dust concentration in Xinjiang.
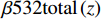
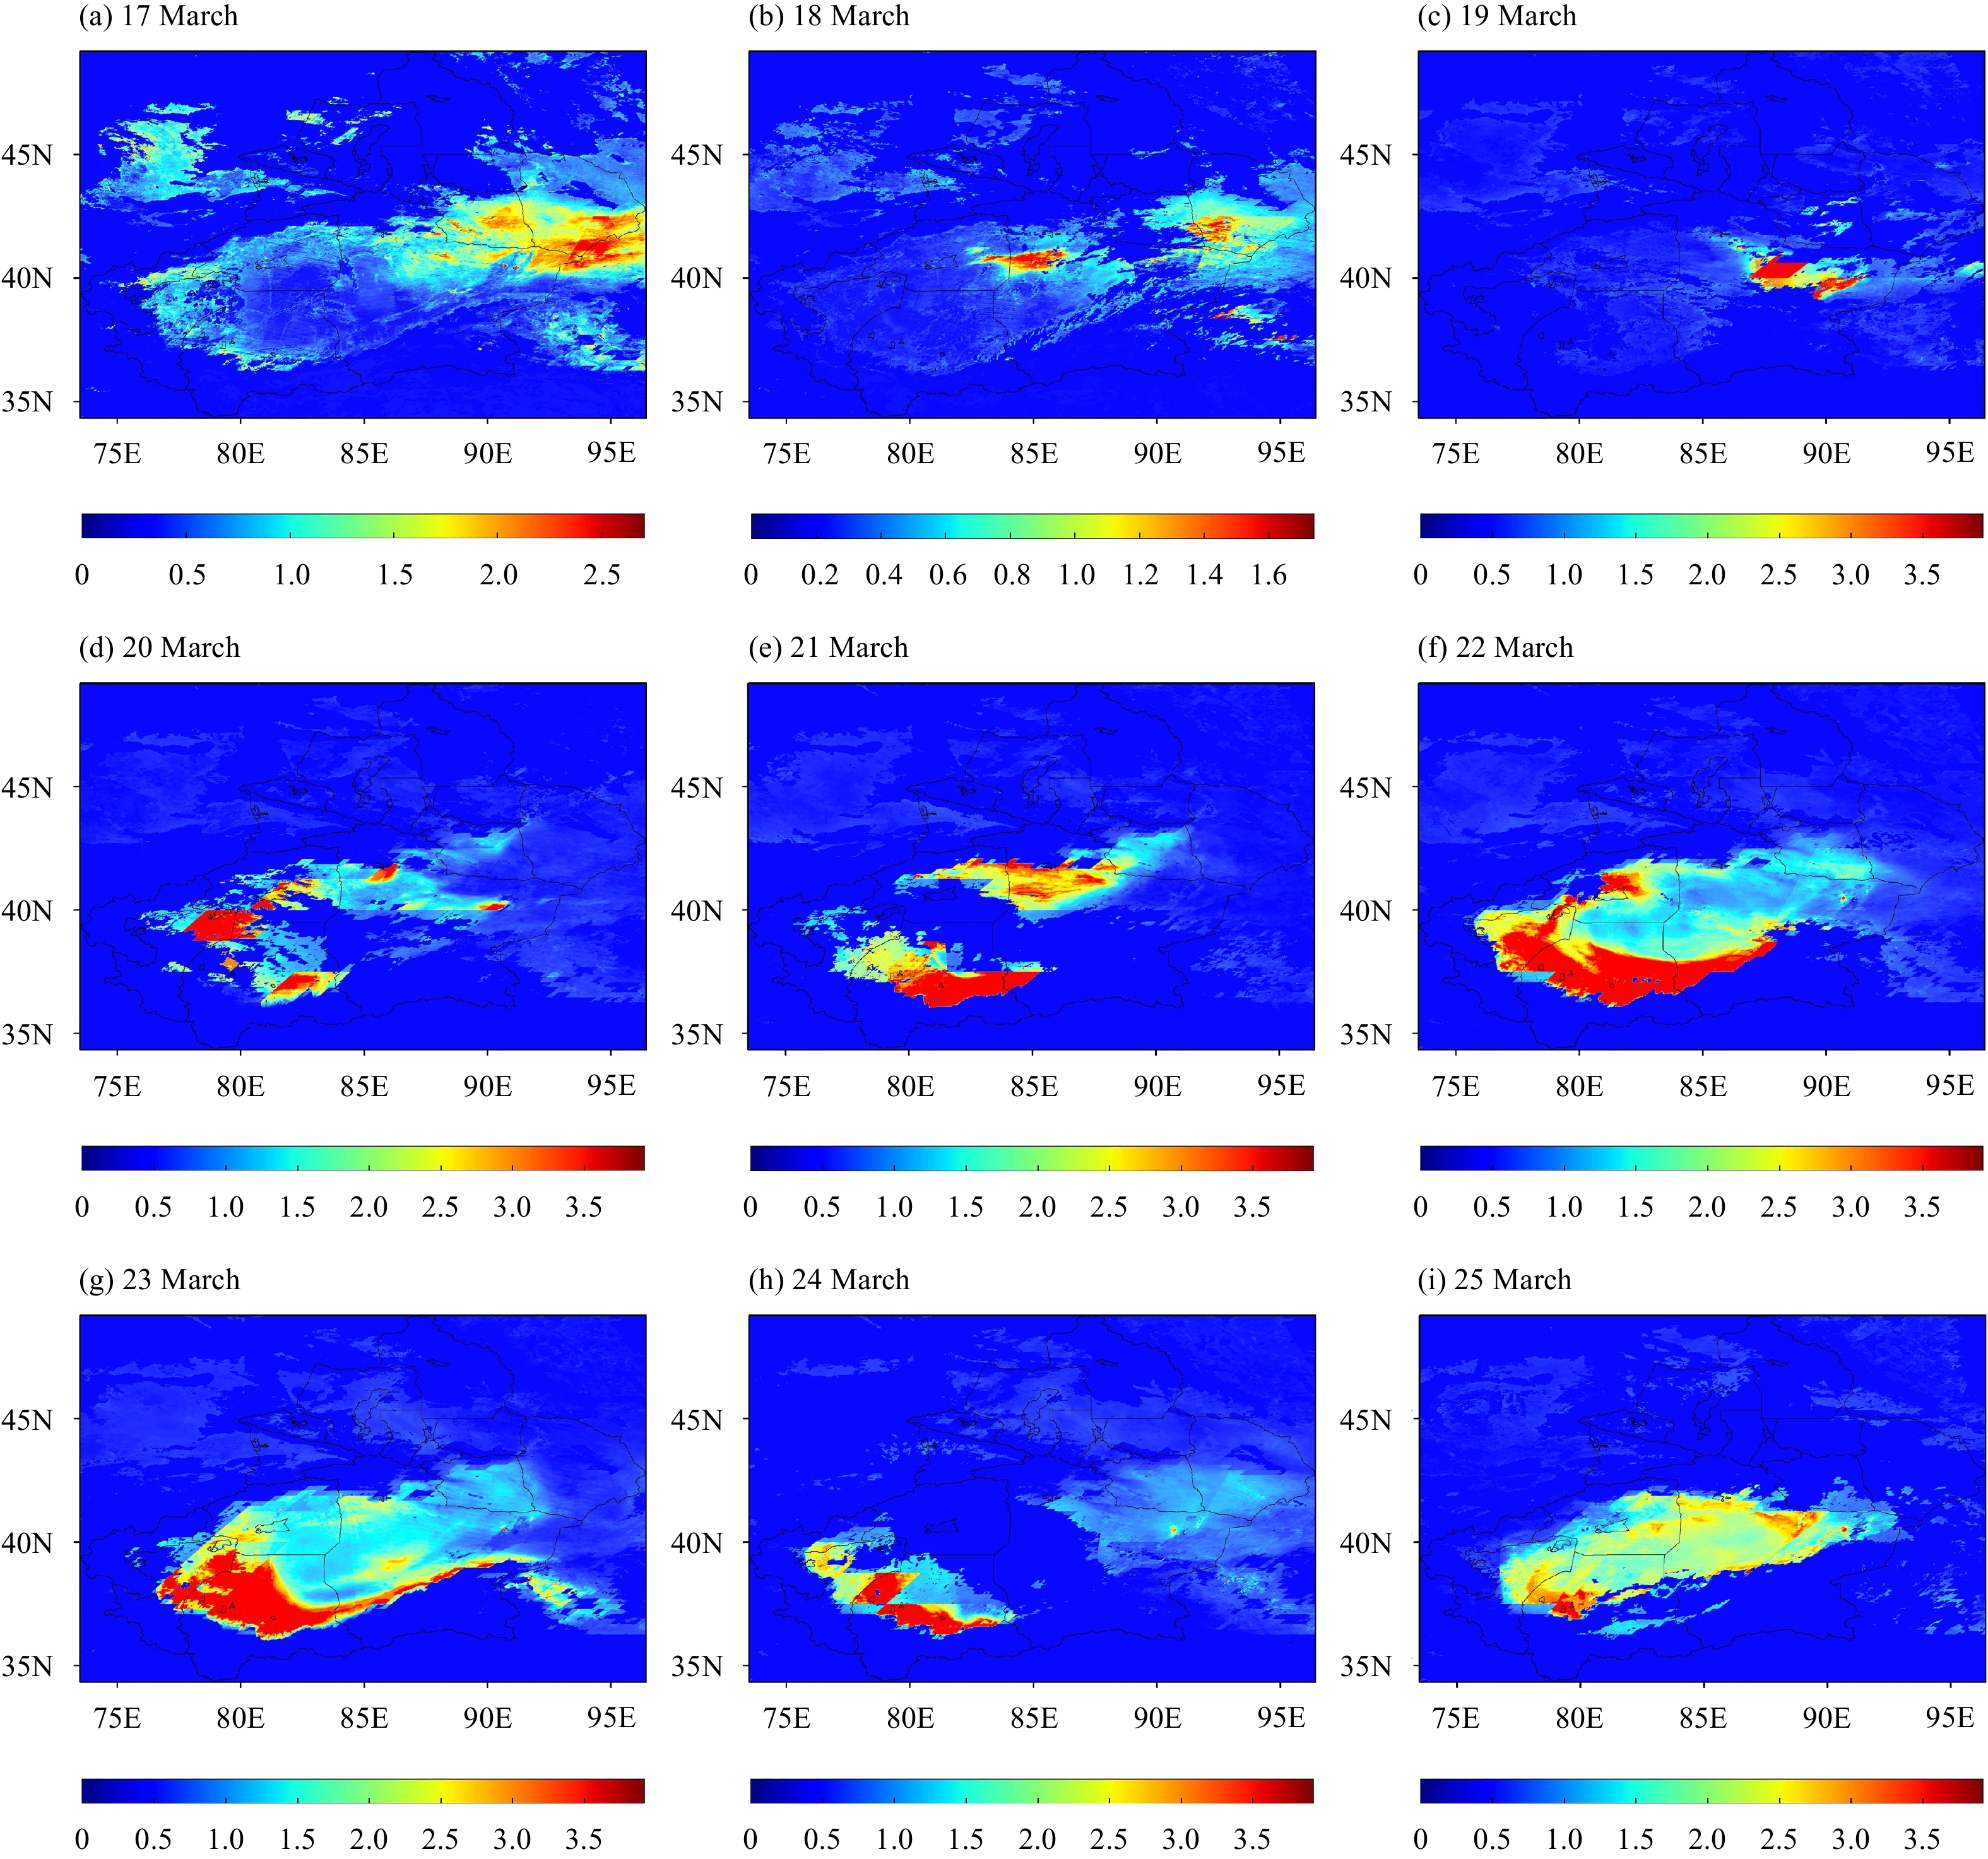
Figure 2 shows spatial distributions of AOD during the dust period, and Fig. 3 shows the daily average variation of AOD across the entire Xinjiang region. By combining the data presented in these two figures, it can be seen clearly that high-value AOD began to appear on 19 March, mainly over the southeastern Bazhou and Turpan basin, with the highest value exceeding 3.5. However, at this stage, the dust storm was relatively weak and the area affected was comparatively small. From 20 to 21 March, the dust spread in the southwesterly direction, reaching the south Xinjiang basin, during which the storm gradually strengthened. On 22 March, the dust activity reached a peak, with the AOD values approaching 4 in some areas of the south Xinjiang basin. From 22 to 23 March, the dust cloud was mainly concentrated over the Tarim basin and Taklamakan desert, with a significant increase in dust intensity and marked expansion of the dust affected areas. Thereafter, a notable reduction in the extent of the area covered by dust was found on 24 March, and there was a distinct subsidence of the storm strength. The areas still affected at this point included Hotan, Kashgar, and Kezhou.
Fig
3.
Evolution of the AOD averaged over the Xinjiang region during 17–25 March 2019.
3.2
Variation in PM concentration during the dust event
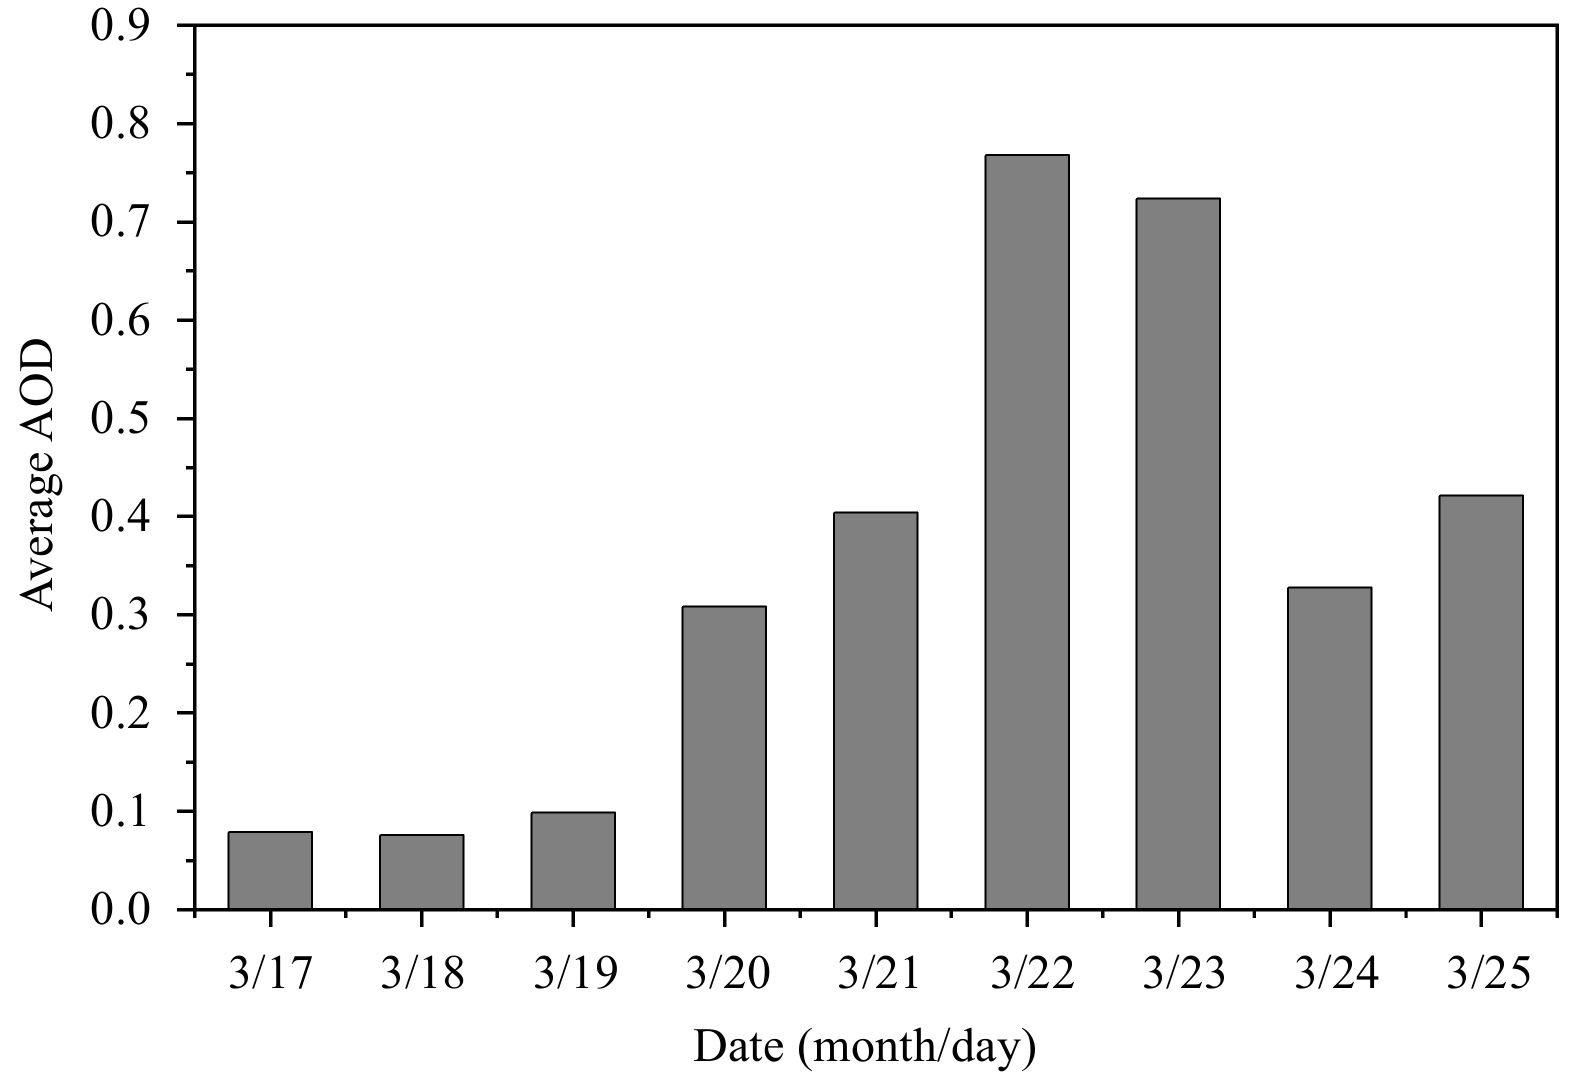
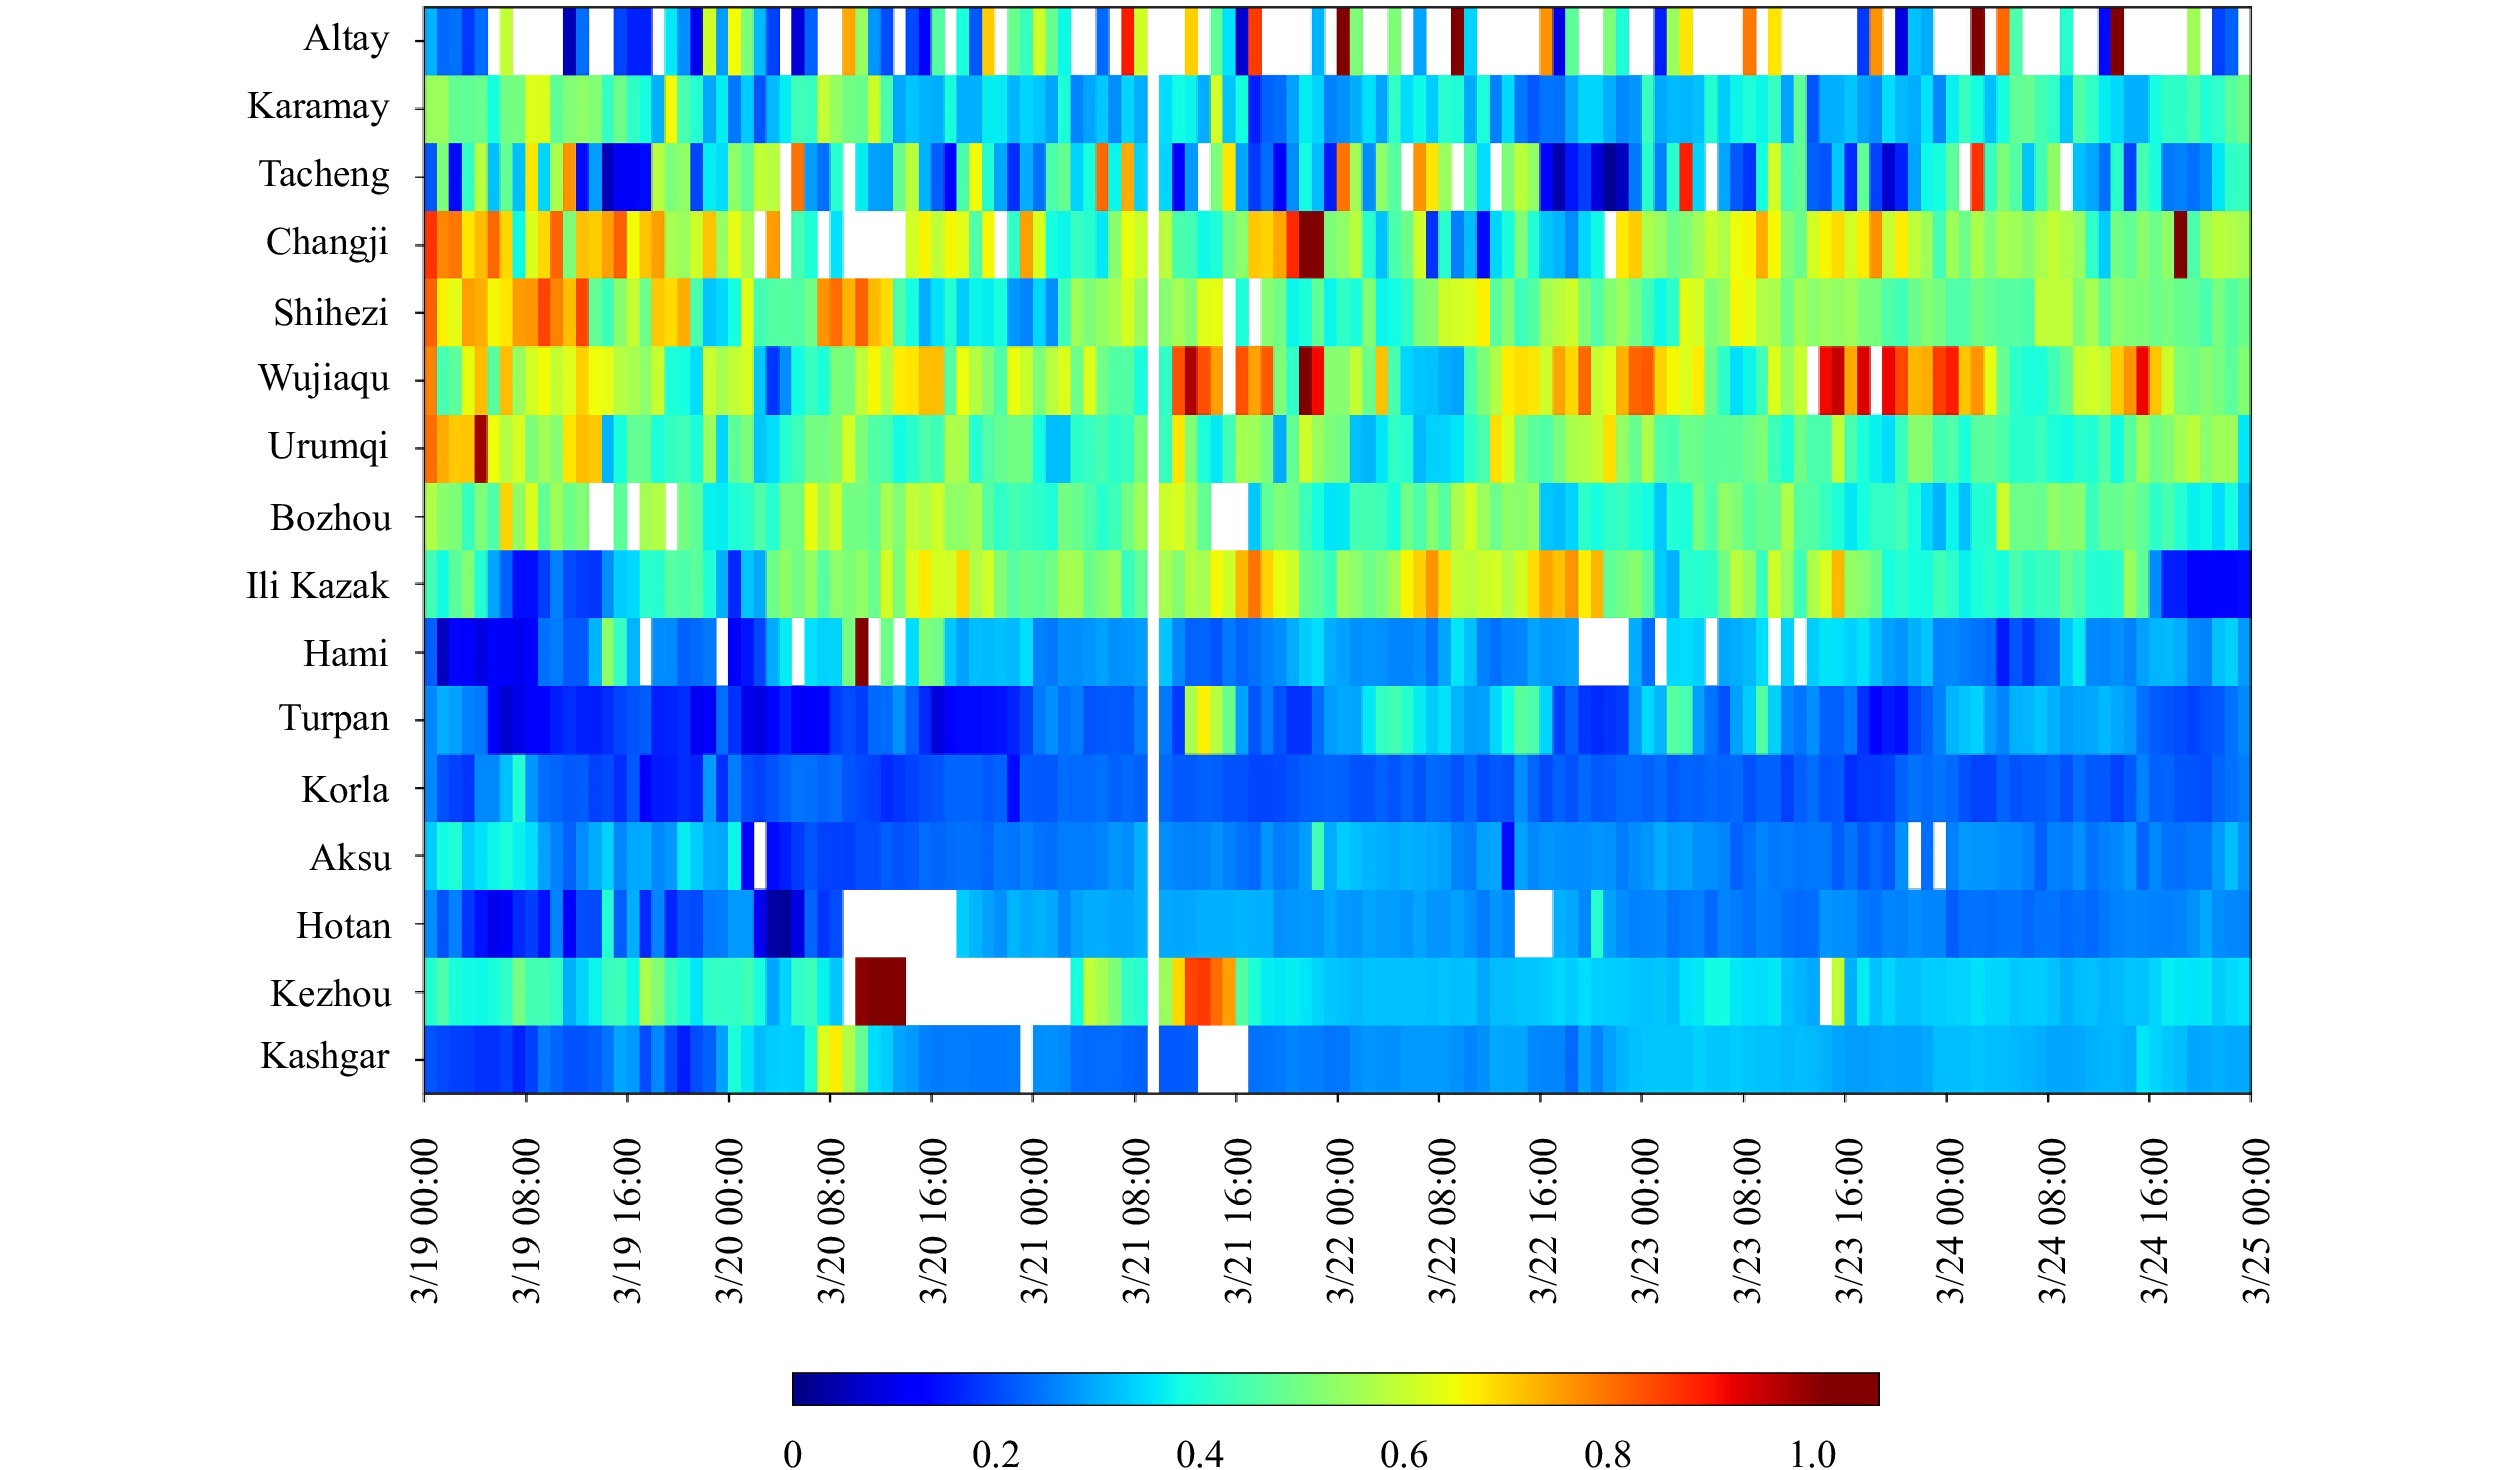
To investigate the influence of this strong dust storm on air quality, we selected air quality monitoring data collected for the period from 19 to 24 March 2019, and analyzed the change characteristics of PM10 concentration and the ratio of PM2.5/PM10 in different regions of Xinjiang. The PM10 concentrations in 16 cities during the dust episode are shown in Fig. 4. For each city, these concentrations are presented as the averages of the monitoring results obtained from all state-controlled stations within that city. The data indicate that Xinjiang had been affected by the dust air mass from 0000 LT (local time) 19 March, and the dust was initially detected in the Turpan and Hami areas, although at this point, the dust intensity was low and the duration of the dusty conditions was relatively short. With time, the dust mass subsequently spread to certain areas in southern Xinjiang, and after 1600 LT 19 March, the areas of Korla, Aksu, Kezhou, Kashgar, and Hotan were sequentially affected by the dusty weather, as indicated by a rapid increase in their PM10 concentrations. This period was marked by a strengthening of the storm intensity, which was sustained for a prolonged period. In contrast, most areas of the northern Xinjiang were comparatively little affected by the dust storm, with only slight changes in the PM10 concentration during the dust event. These findings are essentially consistent with the results presented in Section 3.1. Figure 5 shows that the characteristics of the PM2.5/PM10 ratio recorded in cities changed during the dust period, with values obtained for the areas severely affected by the dust being mainly in the range of 0.2–0.4, indicating a high percentage of coarse particles in the atmosphere. Given the strength of the dust storm and the unfavorable diffusion conditions, the dusting process continued to affect Xinjiang for a protracted period of time.
Fig
5.
As in Fig. 4, but for the PM2.5/PM10 ratio.
3.3
Vertical distribution of aerosol optical properties
3.3.1
Aerosol classification
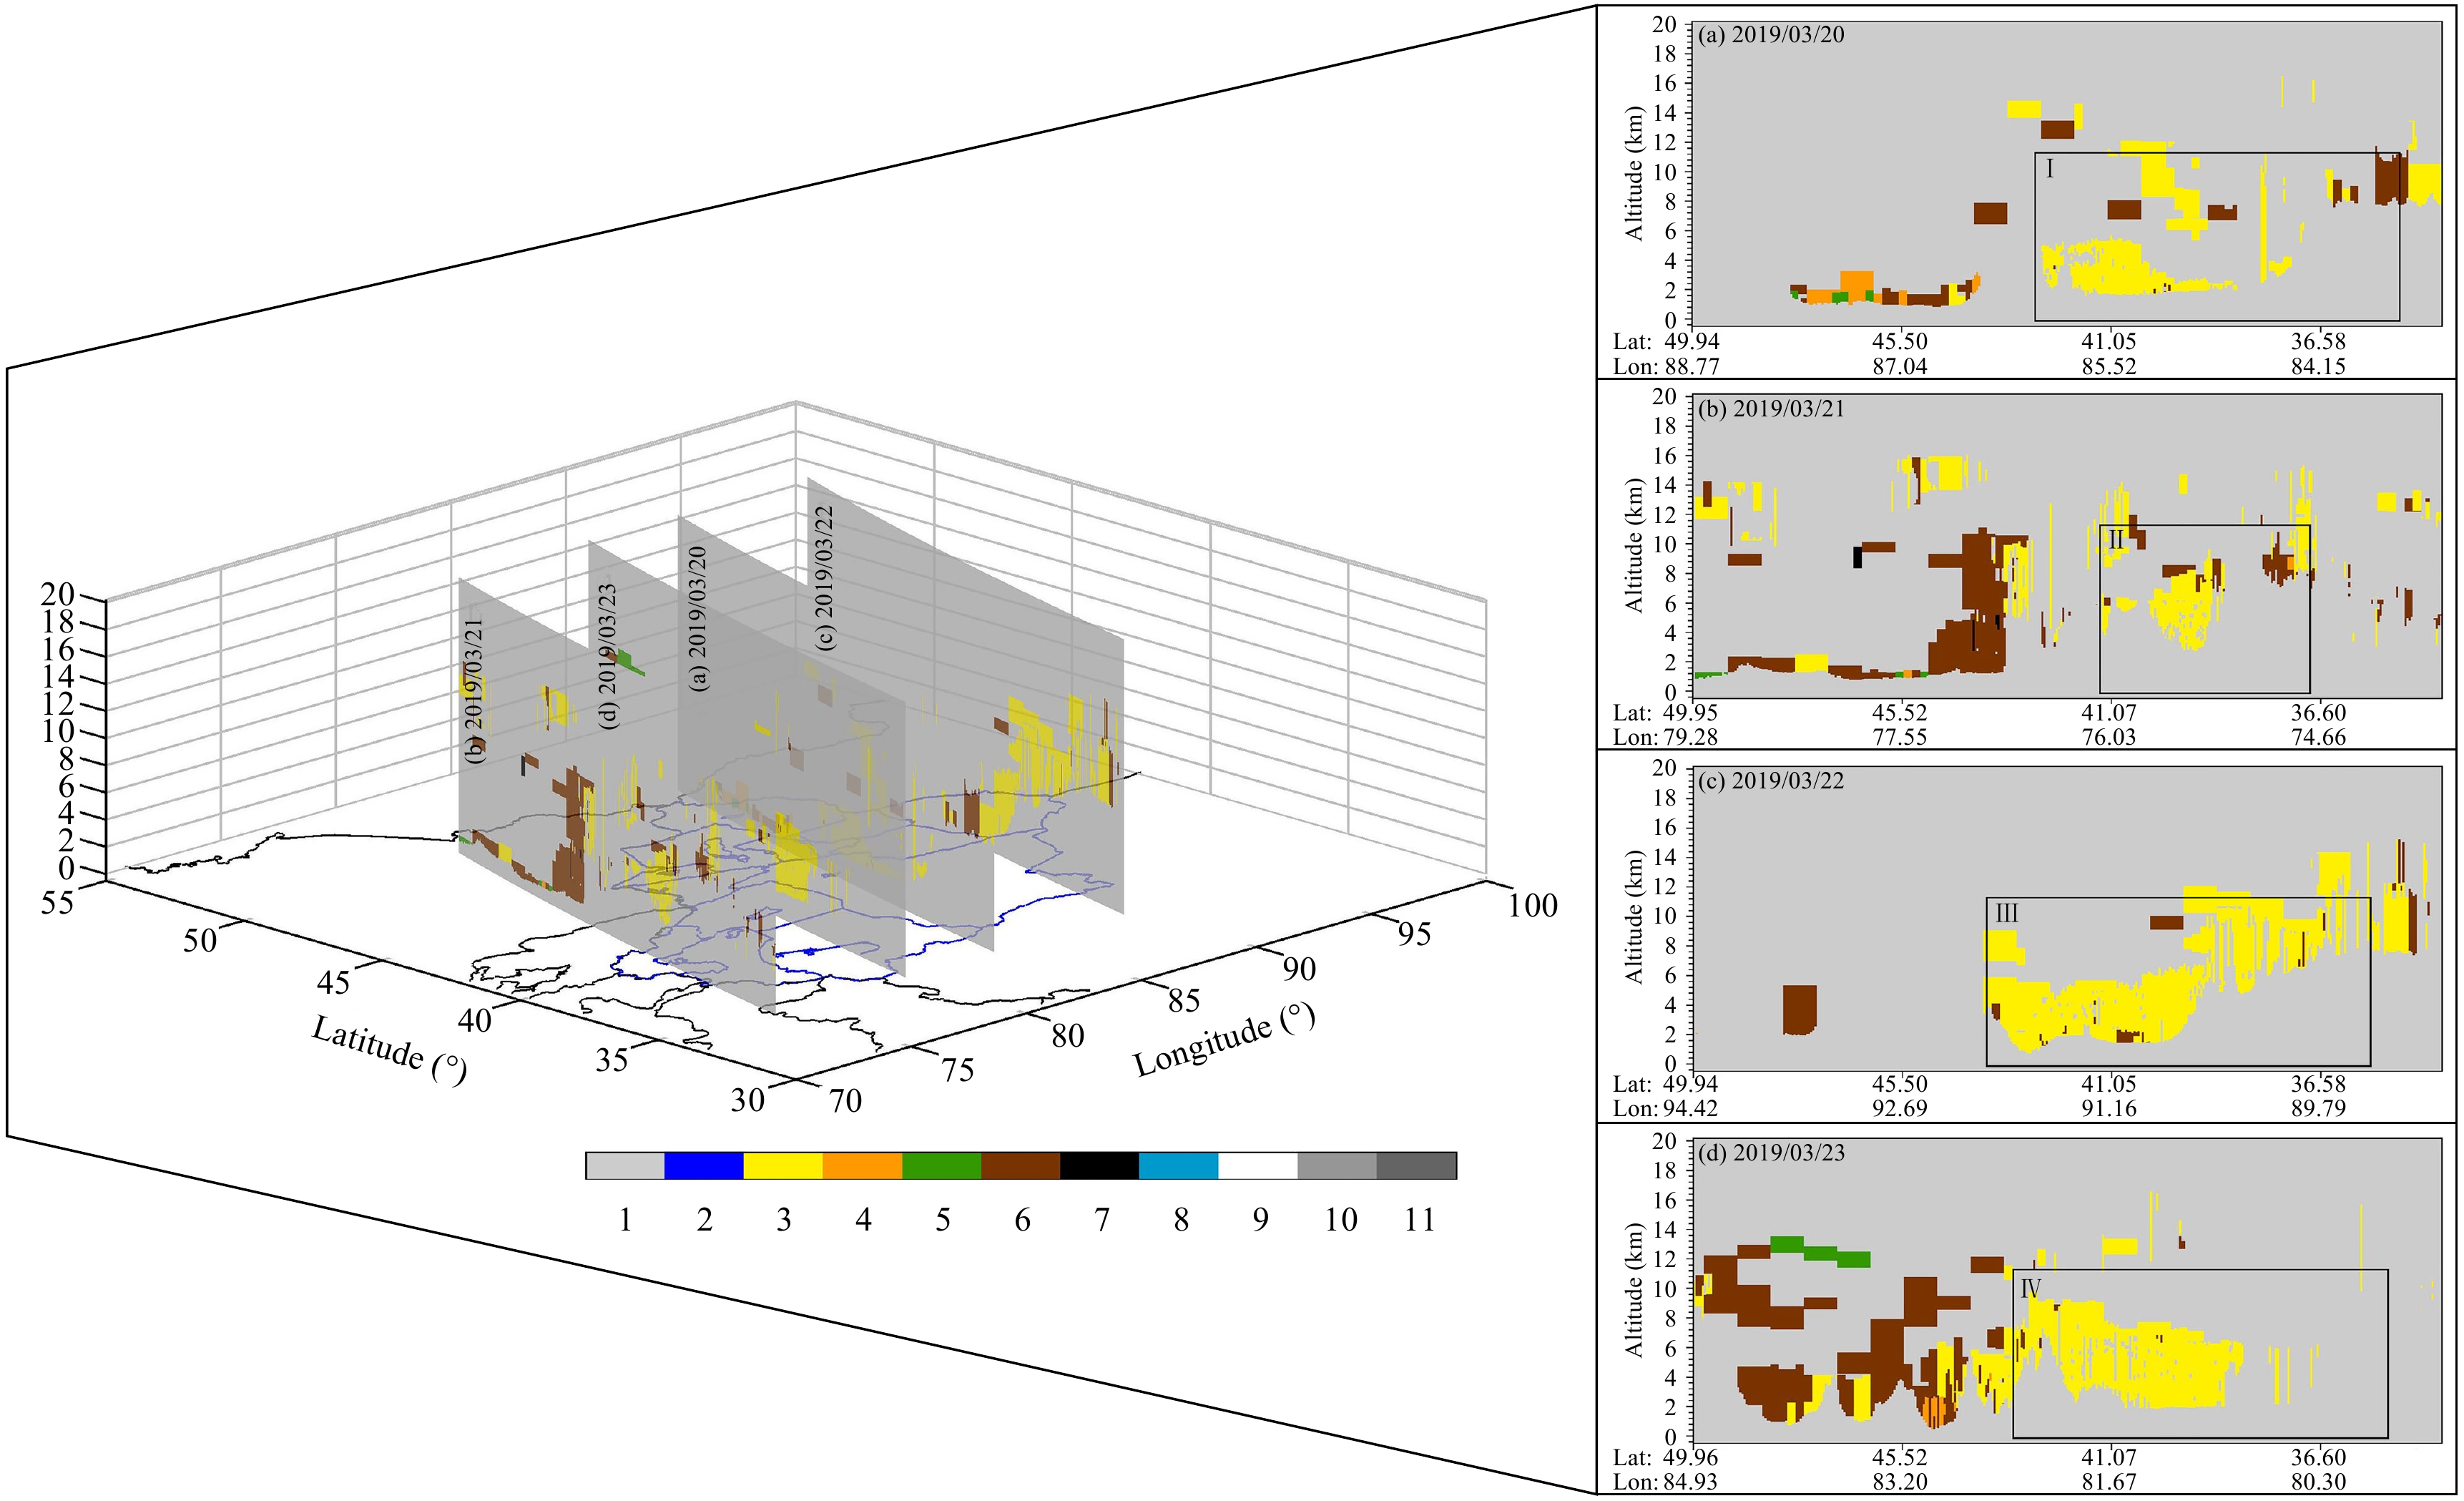
To investigate the vertical distribution of aerosols over the course of this dust event, we acquired CALIPSO L2 VFM data for the entire Xinjiang region for the period of 20–23 March, and analyzed the nighttime aerosol distribution profile in the areas in which dusty weather occurred during the transit of CALIPSO satellite orbits. On the basis of the time sequence of CALIPSO satellite orbit transit, combined with analysis of the results in Sections 3.1 and 3.2, we established that on 20 March, the CALIPSO satellite transited the Changji, Bazhou, Hotan, and Altay areas; at this time, Bazhou and Hotan were the areas affected by dust, as shown in box I in Fig. 6a. On 21 March, the satellite transited the Kezhou area, where dusty weather occurred, as shown in box II in Fig. 6b. On 22 March, the satellite transited the Bazhou, Hami, and Turpan areas, of which the Bazhou and Turpan areas were affected by the dust storm, as shown in box III in Fig. 6c. On 23 March , the satellite transited the Bazhou, Ili Kazak, Aksu, and Hotan areas, and dust was found affecting the Aksu and Hotan areas, as shown in box IV in Fig. 6d. Based on the image analysis, we established that the highly absorbing aerosol particles in the areas with dust occurrence were mainly dust aerosols (yellow), along with small amounts of polluted dust aerosols (brown), with the vertical extent of the latter from 0 to 10 km. Overall, the dust storm continued for the period 19–24 March 2019, during which it affected almost the entire Xinjiang region.
Fig
6.
Temporal evolution of the altitude–orbit distribution of dust subtypes during the dust storm event on (a) 20, (b) 21, (c) 22, and (d) 23 March 2019 (1 = Not Determined, 2 = Clean Marine, 3 = Dust, 4 = Polluted Continental, 5 = Clean Continental, 6 = Polluted Dust, 7 = Smoke, 8 = Dusty Marine, 9 = PSC Aerosol, 10 = Volcanic Ash, 11 = Sulfate/Other). Right panels are enlarged displays of the corresponding left panels. Boxes I, II, III, and IV in the right panels refer to the areas affected by the dust storm.
3.3.2
Vertical distribution of β532||
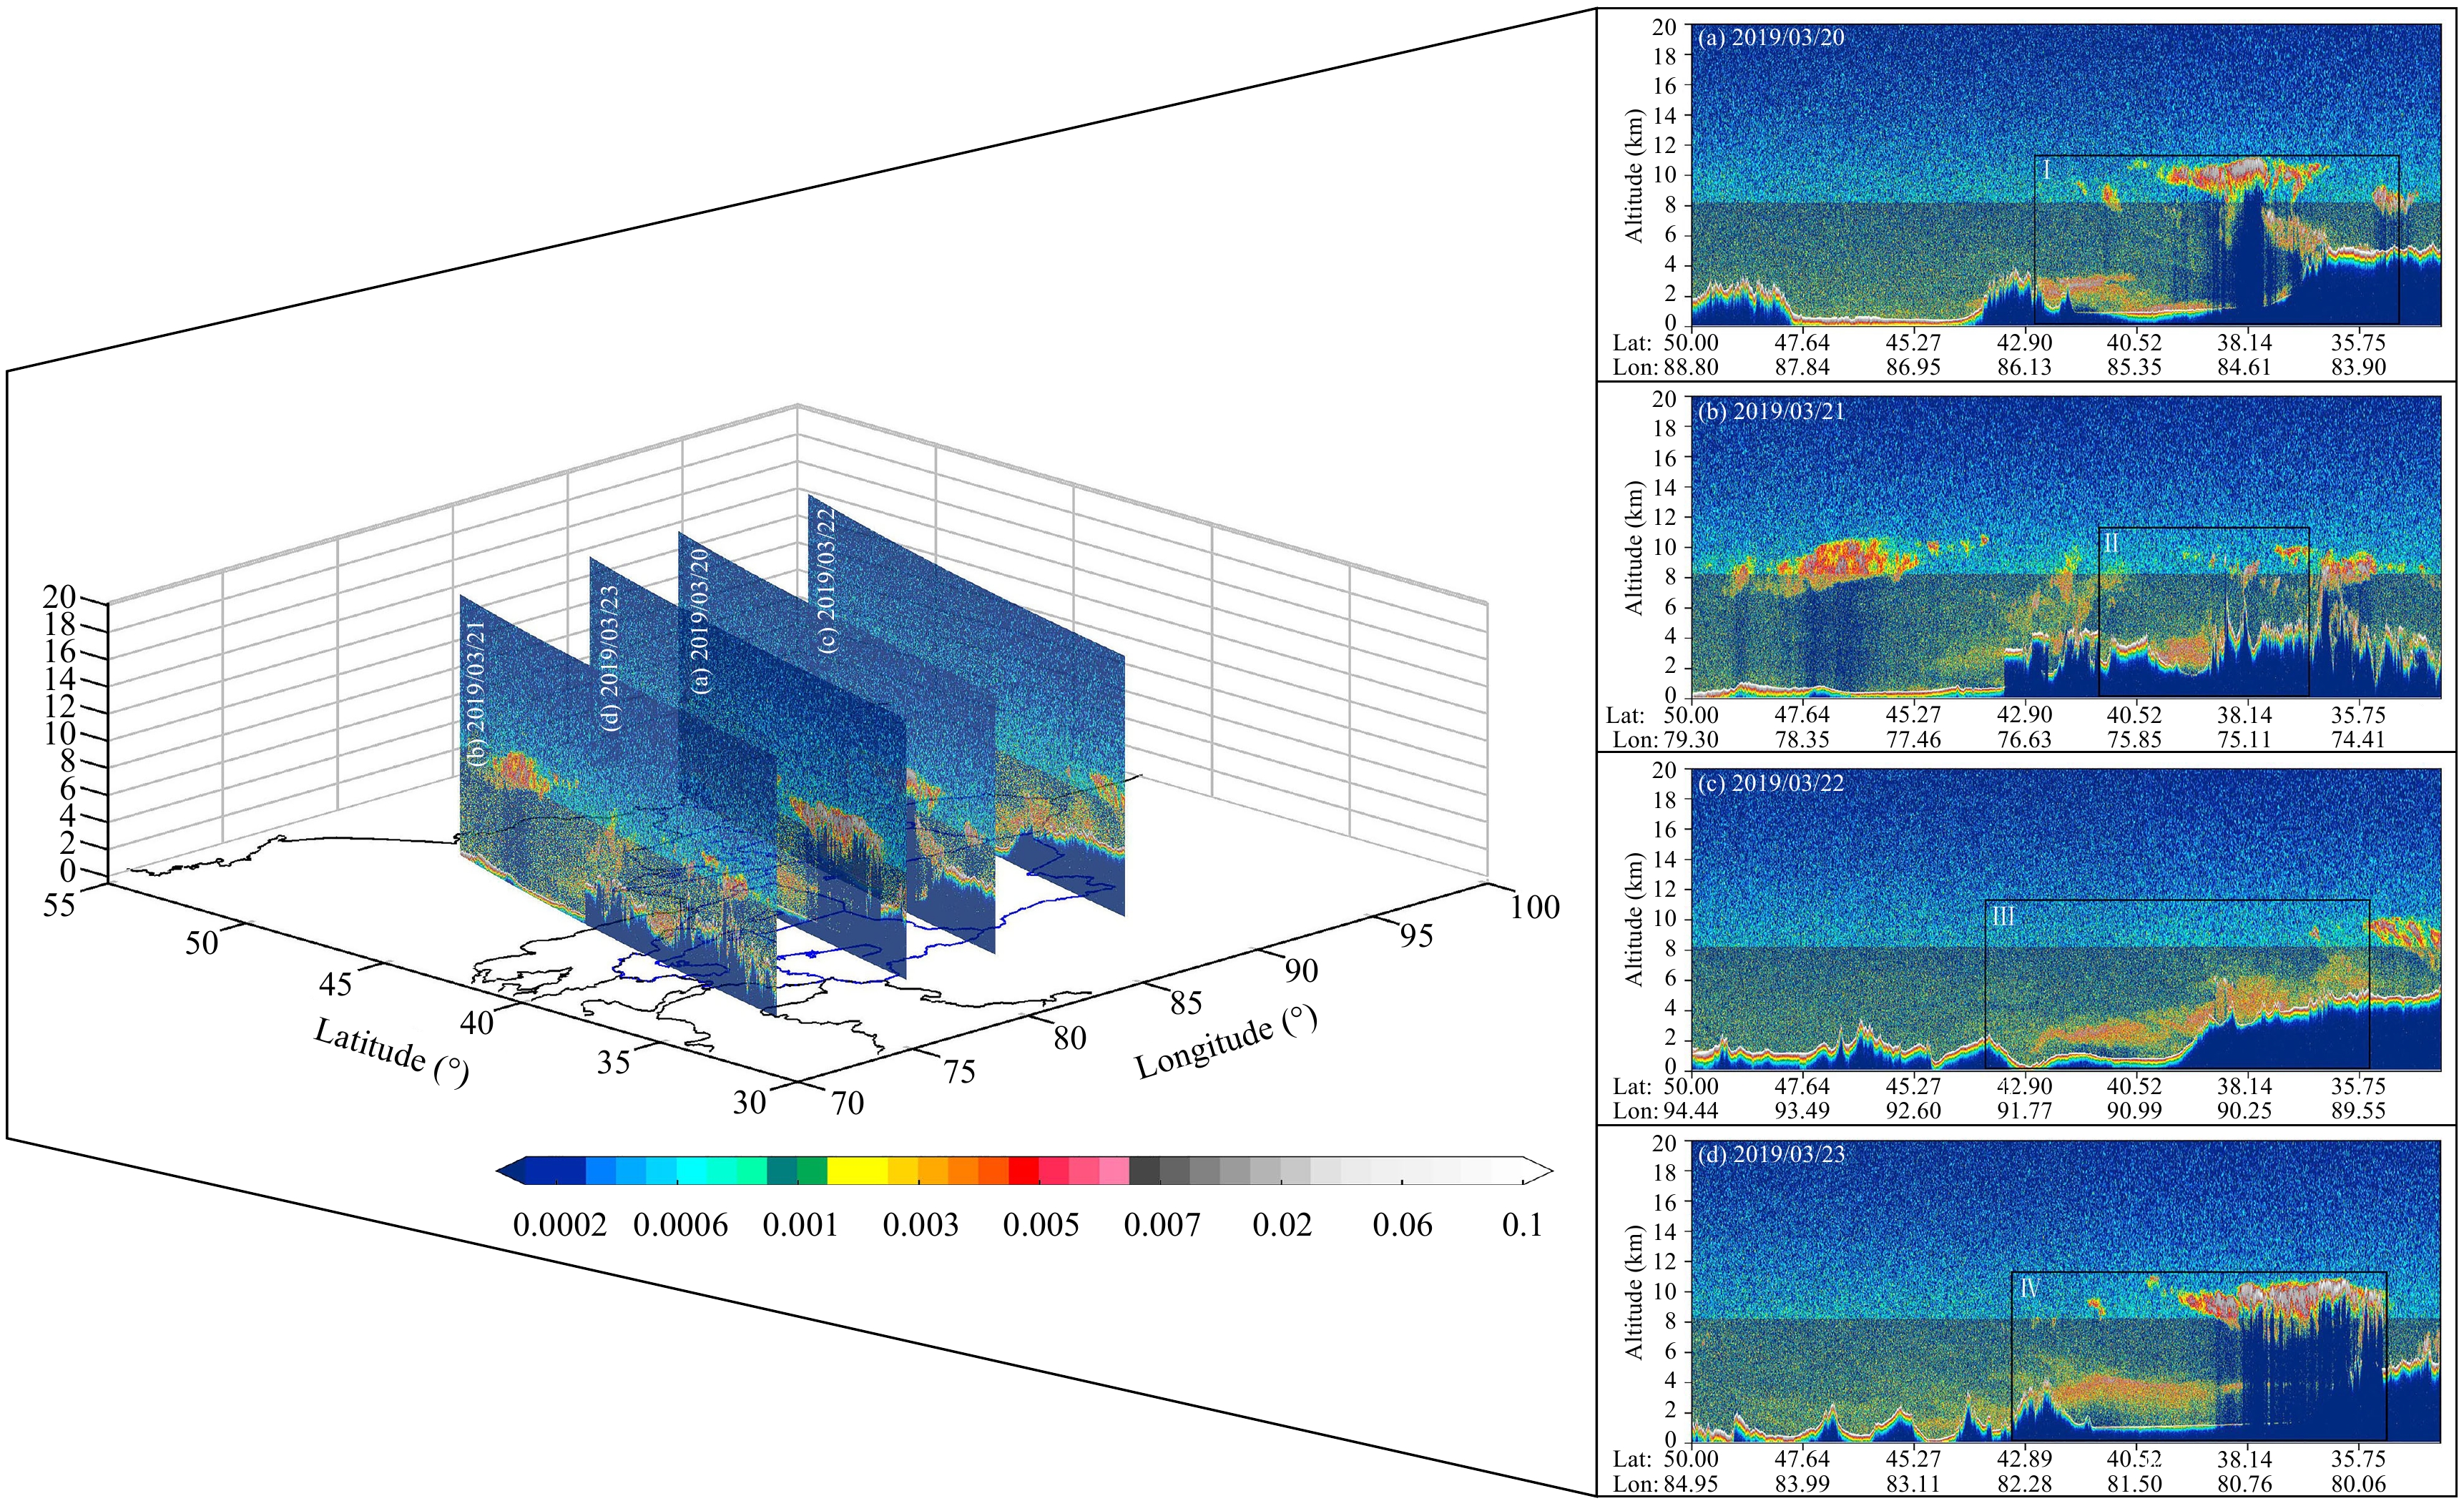
The attenuated backscatter coefficient at 532 nm (β532||) reflects the scattering ability of atmospheric PM, with high (low) values indicative of strong (weak) scattering. In general, particles with β532|| values in the range of 0.0008–0.0045 are aerosols (Huang et al., 2008; Liu Z. et al., 2008). Figure 7 illustrates the altitude–orbit cross-section of β532|| measured from 20 to 23 March. The dark blue portions at the base of the figure represent missing data due to topographical influences. A notable orange–red zone appears on each of the four days, representing a large number of aerosol particles, which are mainly concentrated at altitudes from 0 to 10 km. This indicates that the CALIPSO satellite detected distinct dusty conditions when passing over the Xinjiang region.
Fig
7.
As in Fig. 6, but for the attenuated backscatter coefficient at 532 nm (β532||).
On 20 March, the dust cloud appeared mainly over the Bazhou and Hotan areas, The aerosol β532|| over these regions was primarily concentrated at altitudes of 0–8 km, with obvious cloud distribution over 8–10 km, and a proportionally higher layer of particles of low β532|| values. These data thus tend to indicate a weaker scattering ability in the upper atmosphere. On 21 March, the aerosol β532|| values detected over the Kezhou region were more evenly distributed within the vertical range of 2–8 km, in which the proportion with higher values gradually declined with increasing altitude, as reflected by a reduction in scattering ability. On 22 March, the dust mainly covered the Bazhou and Turpan areas, in which the aerosol β532|| was primarily distributed over 0–8-km altitudes, with high values being evenly distributed at all assessed altitude levels. On 23 March, the dust cloud was detected mainly over the Aksu and Hotan areas, with high aerosol β532|| values distributed between 2 and 4 km. Although there were large amounts of clouds at elevations 8–10 km, there were still more aerosol particles distributed. Figure 8 shows the frequency distribution of aerosol β532|| at different altitudes. In conjunction with the aforementioned analyses, these data clearly indicate an increase in proportion of high values of aerosol β532||, coinciding with the passage of the dust storm; and the vertical distribution is significantly elevated, indicating that the scattering ability is enhanced under the dusty conditions and the height of the boundary layer is elevated to a certain extent.
Fig
8.
Frequency distributions of β532∥ at different altitudes on (a) 20, (b) 21, (c) 22, and (d) 23 March 2019.
The data presented in Fig. 8 reveal that the overall variations of aerosol β532|| over the areas influenced by the dust storm within the 4 days are similar, being characterized by a reduction in the percentage of high β532|| values with the increasing altitude. This feature is particularly conspicuous for 21 and 22 March. At altitudes from 0 to 8 km, the β532|| values were more homogenously dispersed among different altitude levels and these values were generally high, thereby having a considerable bearing on visibility, as reflected in stronger scattering ability of absorbing particles. Within 2–4 km, the proportion of β532|| with values of 0.0025–0.0045 was higher than that recorded at other altitude levels, indicating that the aerosol scattering ability of particles was strongest over 2–4-km altitudes. In contrast, in the upper troposphere of 8–10 km, the proportion of β532|| with low values of 0.0008–0.0025 was higher, corresponding to the weakest aerosol scattering ability.
3.3.3
Vertical distribution of depolarization ratio
The parameter depolarization ratio (PDR) is a measure of the degree of aerosol regularity, which can be used to distinguish between spherical and non-spherical aerosols. The larger the ratio value, the more irregular the aerosol particles. According to previous studies, we define regular spherical aerosols as those with the PDR values of 0–0.3, relatively regular nearly spherical aerosols are considered in the range of 0.3–0.6, and irregular non-spherical aerosols are soluble in the range of 0.6–1.0 (Liu Z. Y. et al., 2008). Figure 9 shows the vertical distribution of aerosol PDR values at 532 nm.
Fig
9.
As in Fig. 6, but for the depolarization ratio (PDR).
As shown in Fig. 9, on 20 March, the Bazhou and Hotan areas were characterized by a uniform PDR distribution over altitudes of 0–10 km, and distinct bright-colored areas appeared at each altitude level; i.e., PDR values of 0.2–0.5 were widely distributed over the entire altitude range, indicating existence of a large proportion of regular spherical and relatively regular near-spherical particles in the atmosphere. On 21 March, a considerable variation in PDR values occurred above the Kezhou region, with bright areas primarily distributed within 0–6 km, while smaller PDR values (mostly 0–0.1) appeared over 6–10 km, thereby suggesting a predominance of regular spherical particles in the upper atmosphere. On 22 March, a bright band, indicating high PDR values, was detected at altitudes between 0 and 4 km over the Turpan and Bazhou areas, whereas lower PDR values were recorded at higher altitudes. On 23 March, an extensive bright area was observed over the Aksu and Hotan areas at altitudes of 8–10 km, with a virtual absence of bright areas between 0 and 2 km and relatively lower PDR values at intermediary altitude levels. In summary, the PDR values obtained for the whole troposphere in those areas influenced by the 4-day dust storm were mainly in the range between 0 and 0.5, from which we can tentatively assume that the atmosphere contained comparatively large amounts of regular spherical and relatively regular near-spherical particles during the passage of the storm. Compared with those areas unaffected by this dust event, there was a significant increase in amounts of the relatively regular near-spherical particles, indicating that the irregularity of aerosol particles was more pronounced in dusty weather.
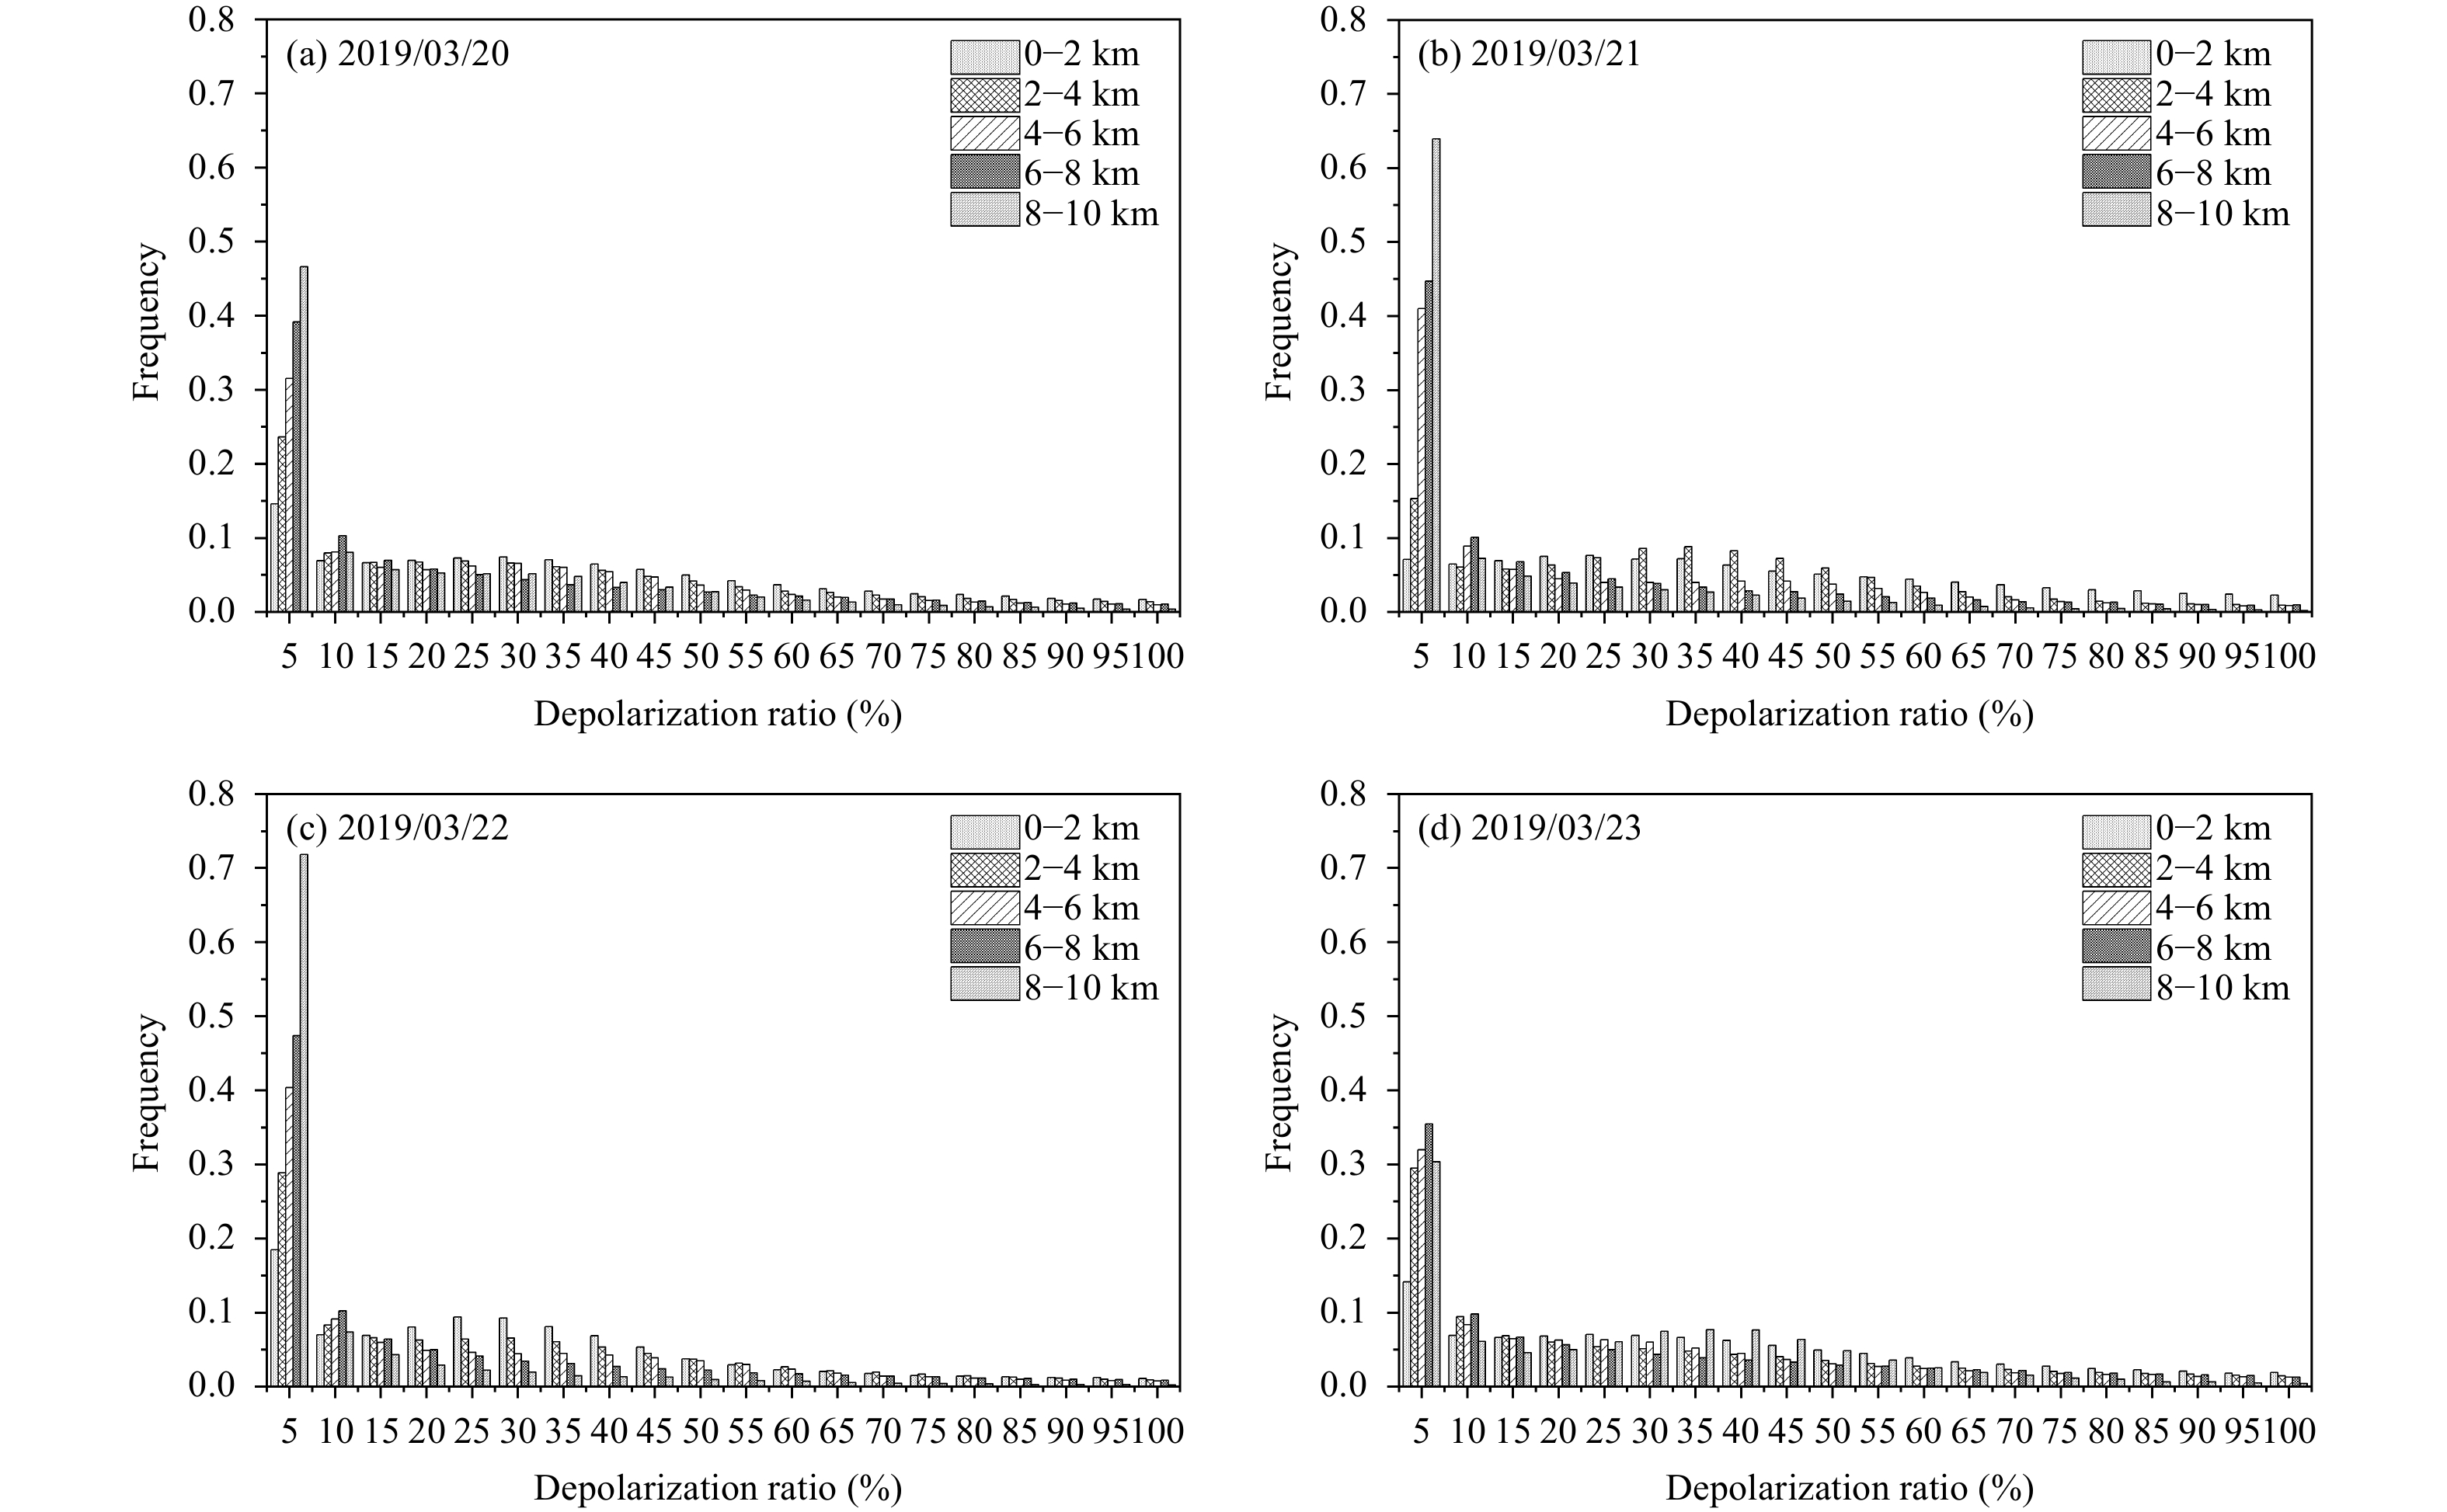
Figure 10 shows frequency distributions of PDR at different altitudes from the ground level to 10 km, featured by a clustering between 0% and 50% that is in general consistent with the results in Fig. 9. Statistical analysis of aerosols with PDR values of 0–0.5 revealed that at altitudes of 0–10 km over the four trajectories, PDR values were predominantly distributed within 0–0.05, thereby indicating that although the irregularity of particles was more discernable during dusty weather, the particle distribution still tended to be dominated by regular spherical particles. The pattern of PDR values in those areas affected by the dusty weather from 20 to 22 March revealed that although in some areas the upper atmosphere was characterized by high PDR values, overall there was a gradual reduction in the proportion of high PDR values with increasing altitude, with the highest proportion of high PDR values being detected at altitudes of 0–4 km, thereby indicating the predominance of irregular particles in the lower atmosphere. On 23 March, the distribution of PDR values at altitudes of 0–8 km in the Aksu and Hotan areas was broadly comparable to those previously mentioned; moreover, we found that the highest percentage of PDR values of 0.25–0.5 occurred over 8–10 km, implying that particle irregularity in the upper atmosphere of this region was more prominent, which might be associated with the intensity and transport of the dust.
Fig
10.
Frequency distributions of the depolarization ratio (PDR) at different altitudes on (a) 20, (b) 21, (c) 22, and (d) 23 March 2019.
3.3.4
Vertical distribution of color ratio
The color ratio (CR) is used to characterize the size of aerosol particles, with higher values being indicative of a larger particle size. CR of 0.5 is used as the threshold value to classify the particle size. Figure 11 shows the CR distribution of aerosols during the dust event, with values ranging from 0.1 to 1.6, indicating a wide range of particle size.
Fig
11.
As in Fig. 6, but for the color ratio (CR).
Measurements performed for 20 March revealed little variation in the CR distribution at altitudes up to 8 km over the Bazhou and Hotan areas. However, over 8–10 km, areas of concentrated high-values were detected, with CR values between 0.9 and 1.1, indicating existence of large-size aerosol particles in the upper atmosphere at this time. On 21 March, there appeared an uneven distribution of CR values at all altitudes over the Kezhou region, with higher CR values at 0–2 km and 8–10 km, and comparatively lower values at other altitudes. On 22 March, in the Turpan and Bazhou areas, a more uniform CR distribution at altitudes up to 8 km was observed, with high values in the upper atmosphere (8–10 km), although this distribution pattern was not so obvious. On 23 March, the CR vertical distribution in the Aksu and Hotan areas was similar to that in the Bazhou and Hotan areas on 20 March, although there was a significant increase in the area of high values between 8 and 10 km, and there was a notable increase in large dust particles. In summary, compared with those areas unaffected by the dust event, there was a substantial increase in the amounts of large aerosol particles in the atmosphere, coinciding with the passage of the dust storm.
The frequency distribution of CR at different altitudes (Fig. 12) reveals no apparent high values for altitudes up to 8 km, indicating that aerosol particles of all size ranges were distributed throughout the atmosphere. The CR values recorded at altitudes between 0 and 2 km were relatively large, indicating that the dust in the dust-affected areas was not completely dispersed to higher altitudes by the wind, and a proportion remained near ground level. In contrast, the CR values for the 8–10-km range showed an overall increasing trend, with the high-frequency CR values being mainly concentrated between 0.9 and 1.1. This thus suggests that during the dust outbreak in Xinjiang, large particles of dust were more likely to be dispersed to higher altitudes in a relatively short period of time, as a consequence of the sparse vegetation coverage and poor subsurface conditions.
Fig
12.
Frequency distributions of the color ratio (CR) at different altitudes on (a) 20, (b) 21, (c) 22, and (d) 23 March 2019.
3.4
Air mass transport during the dust event
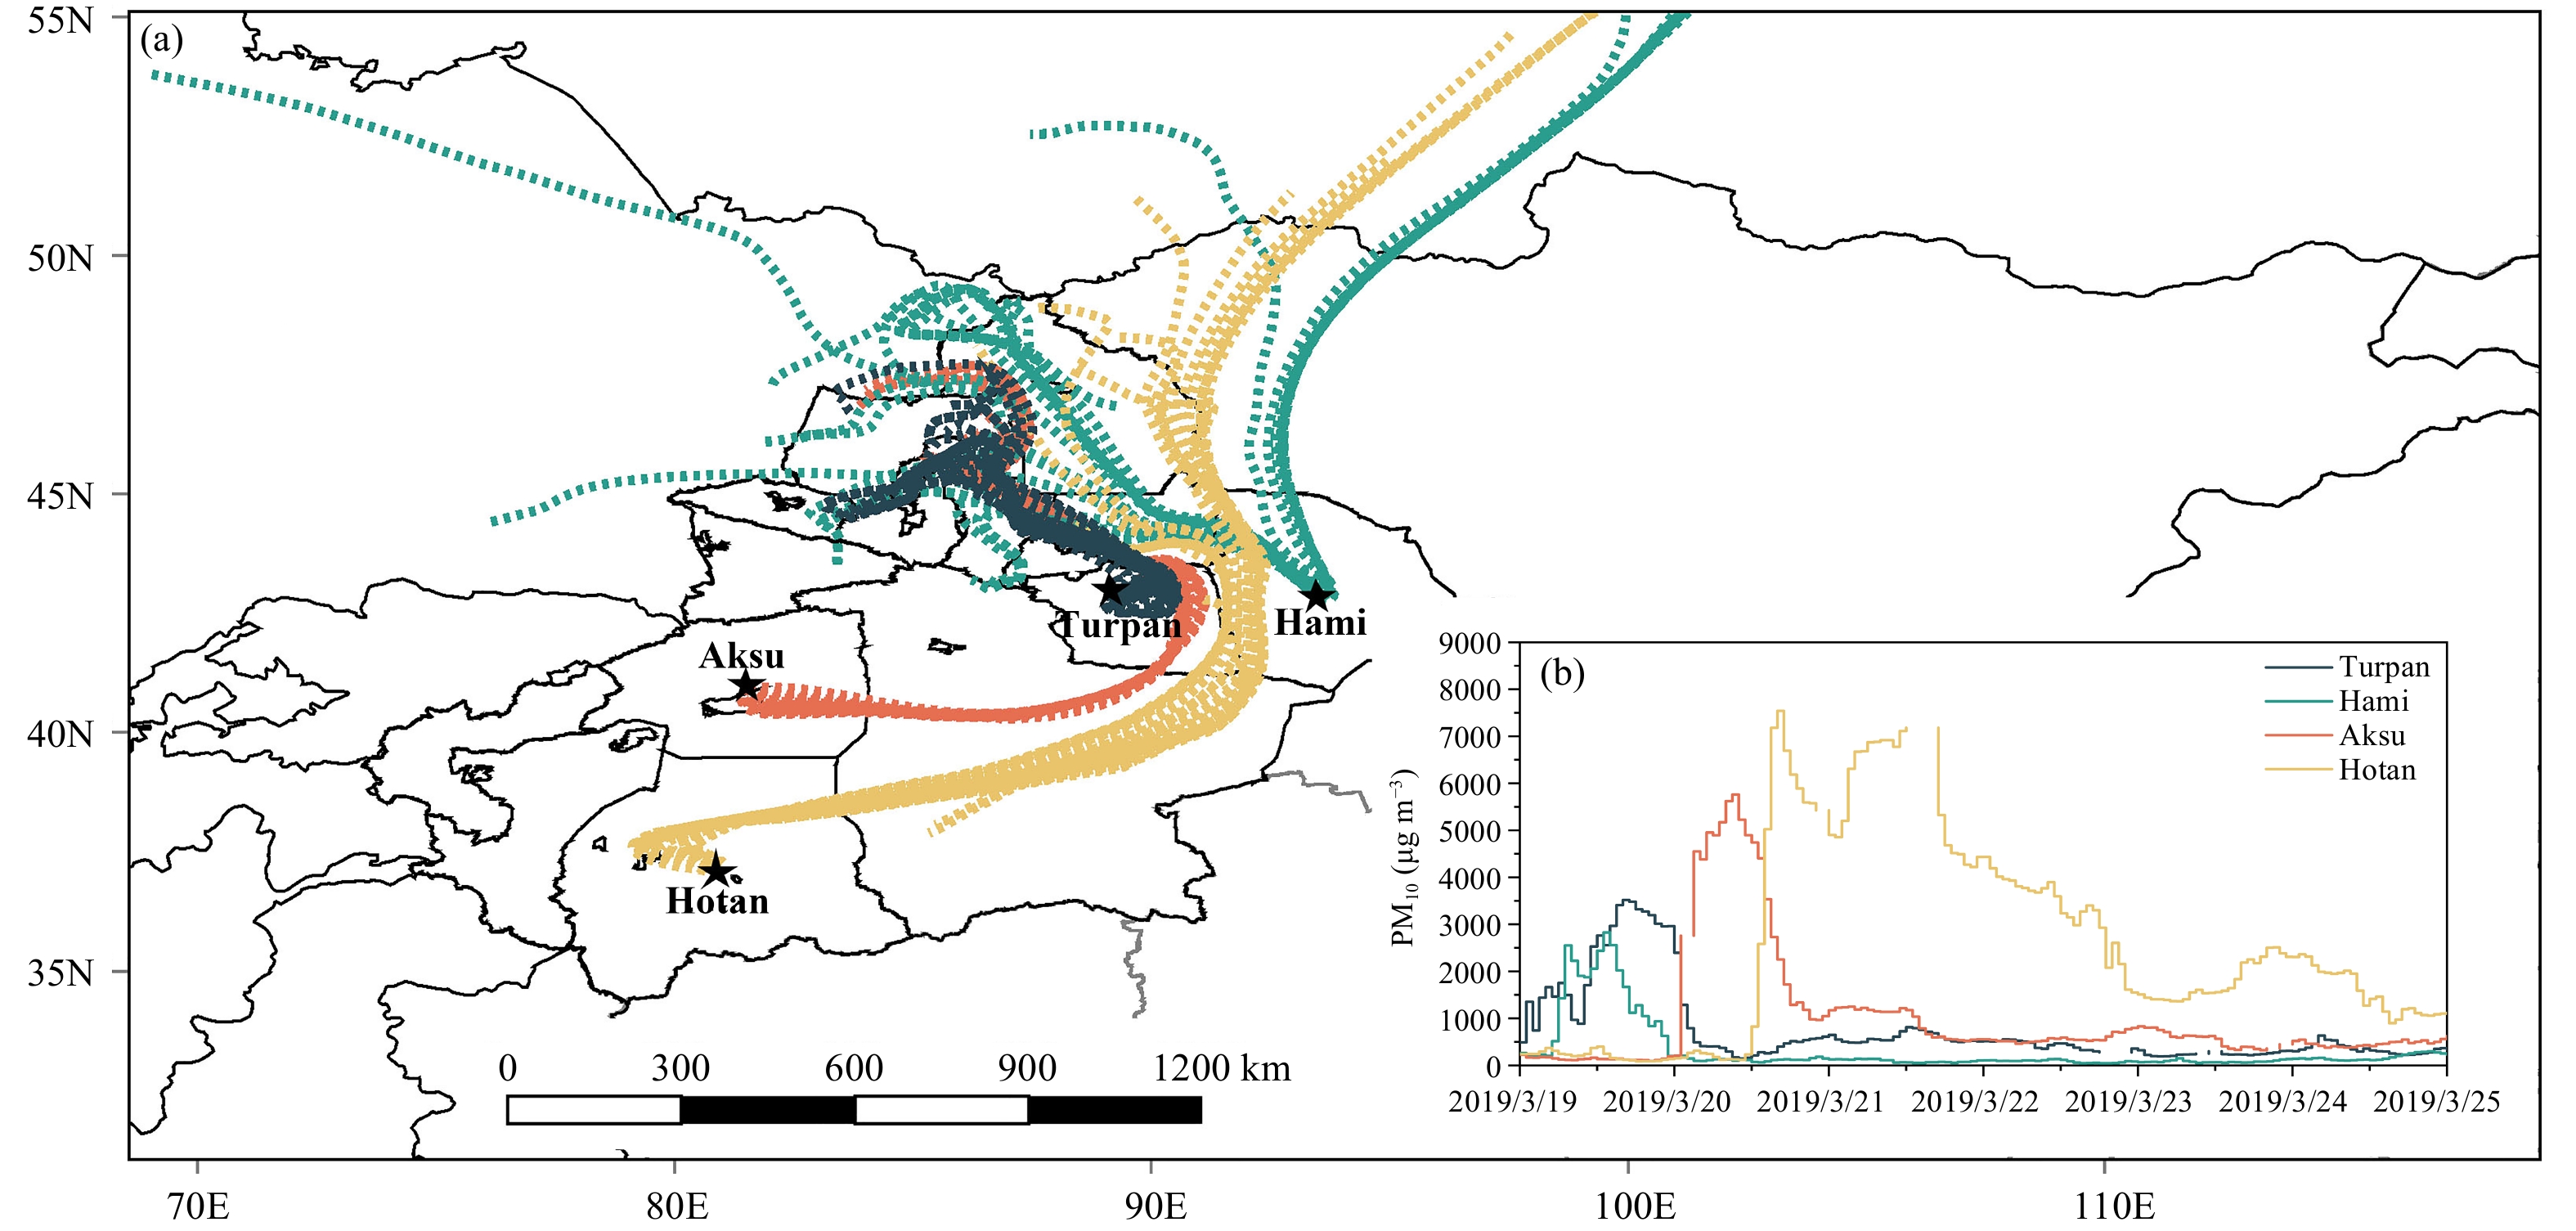
As shown in Fig. 13, most of the trajectories present a source of origin in northwestern Xinjiang, and they intersect prior to reaching their ultimate destinations. Analysis of air mass transport in conjunction with the hourly data for mean PM10 concentrations in the above mentioned cities during this event reveals that the same air mass moved toward the Hami and Turpan areas, and despite the farther distance between Hami and the potential dust source, the local peak PM10 concentration was observed prior to that recorded in Turpan. We speculate that this could be attributable to the nature of the air mass and regional topography. The path of the air mass heading to Hami was relatively unimpeded, while that to Turpan was possibly influenced by certain orographic feature; and several changes in the directions of the air mass were observed during the course of the dust storm’s passage. The passage of air mass towards the Aksu and Hotan areas coincided with an increase in the concentration of PM10, with peak concentration being observed in the Hotan area. The higher PM10 concentrations recorded in Aksu and Hotan areas could be ascribed to the passage of large amounts of air masses over the Taklimakan Desert, during the course of which, large amounts of coarse particles were picked up and subsequently transported to the cities in which monitoring was performed.
Fig
13.
(a) Hourly average backward transport trajectories of air masses over four cities in Xinjiang during the dust event, and (b) hourly mean PM10 concentrations in the four cities.
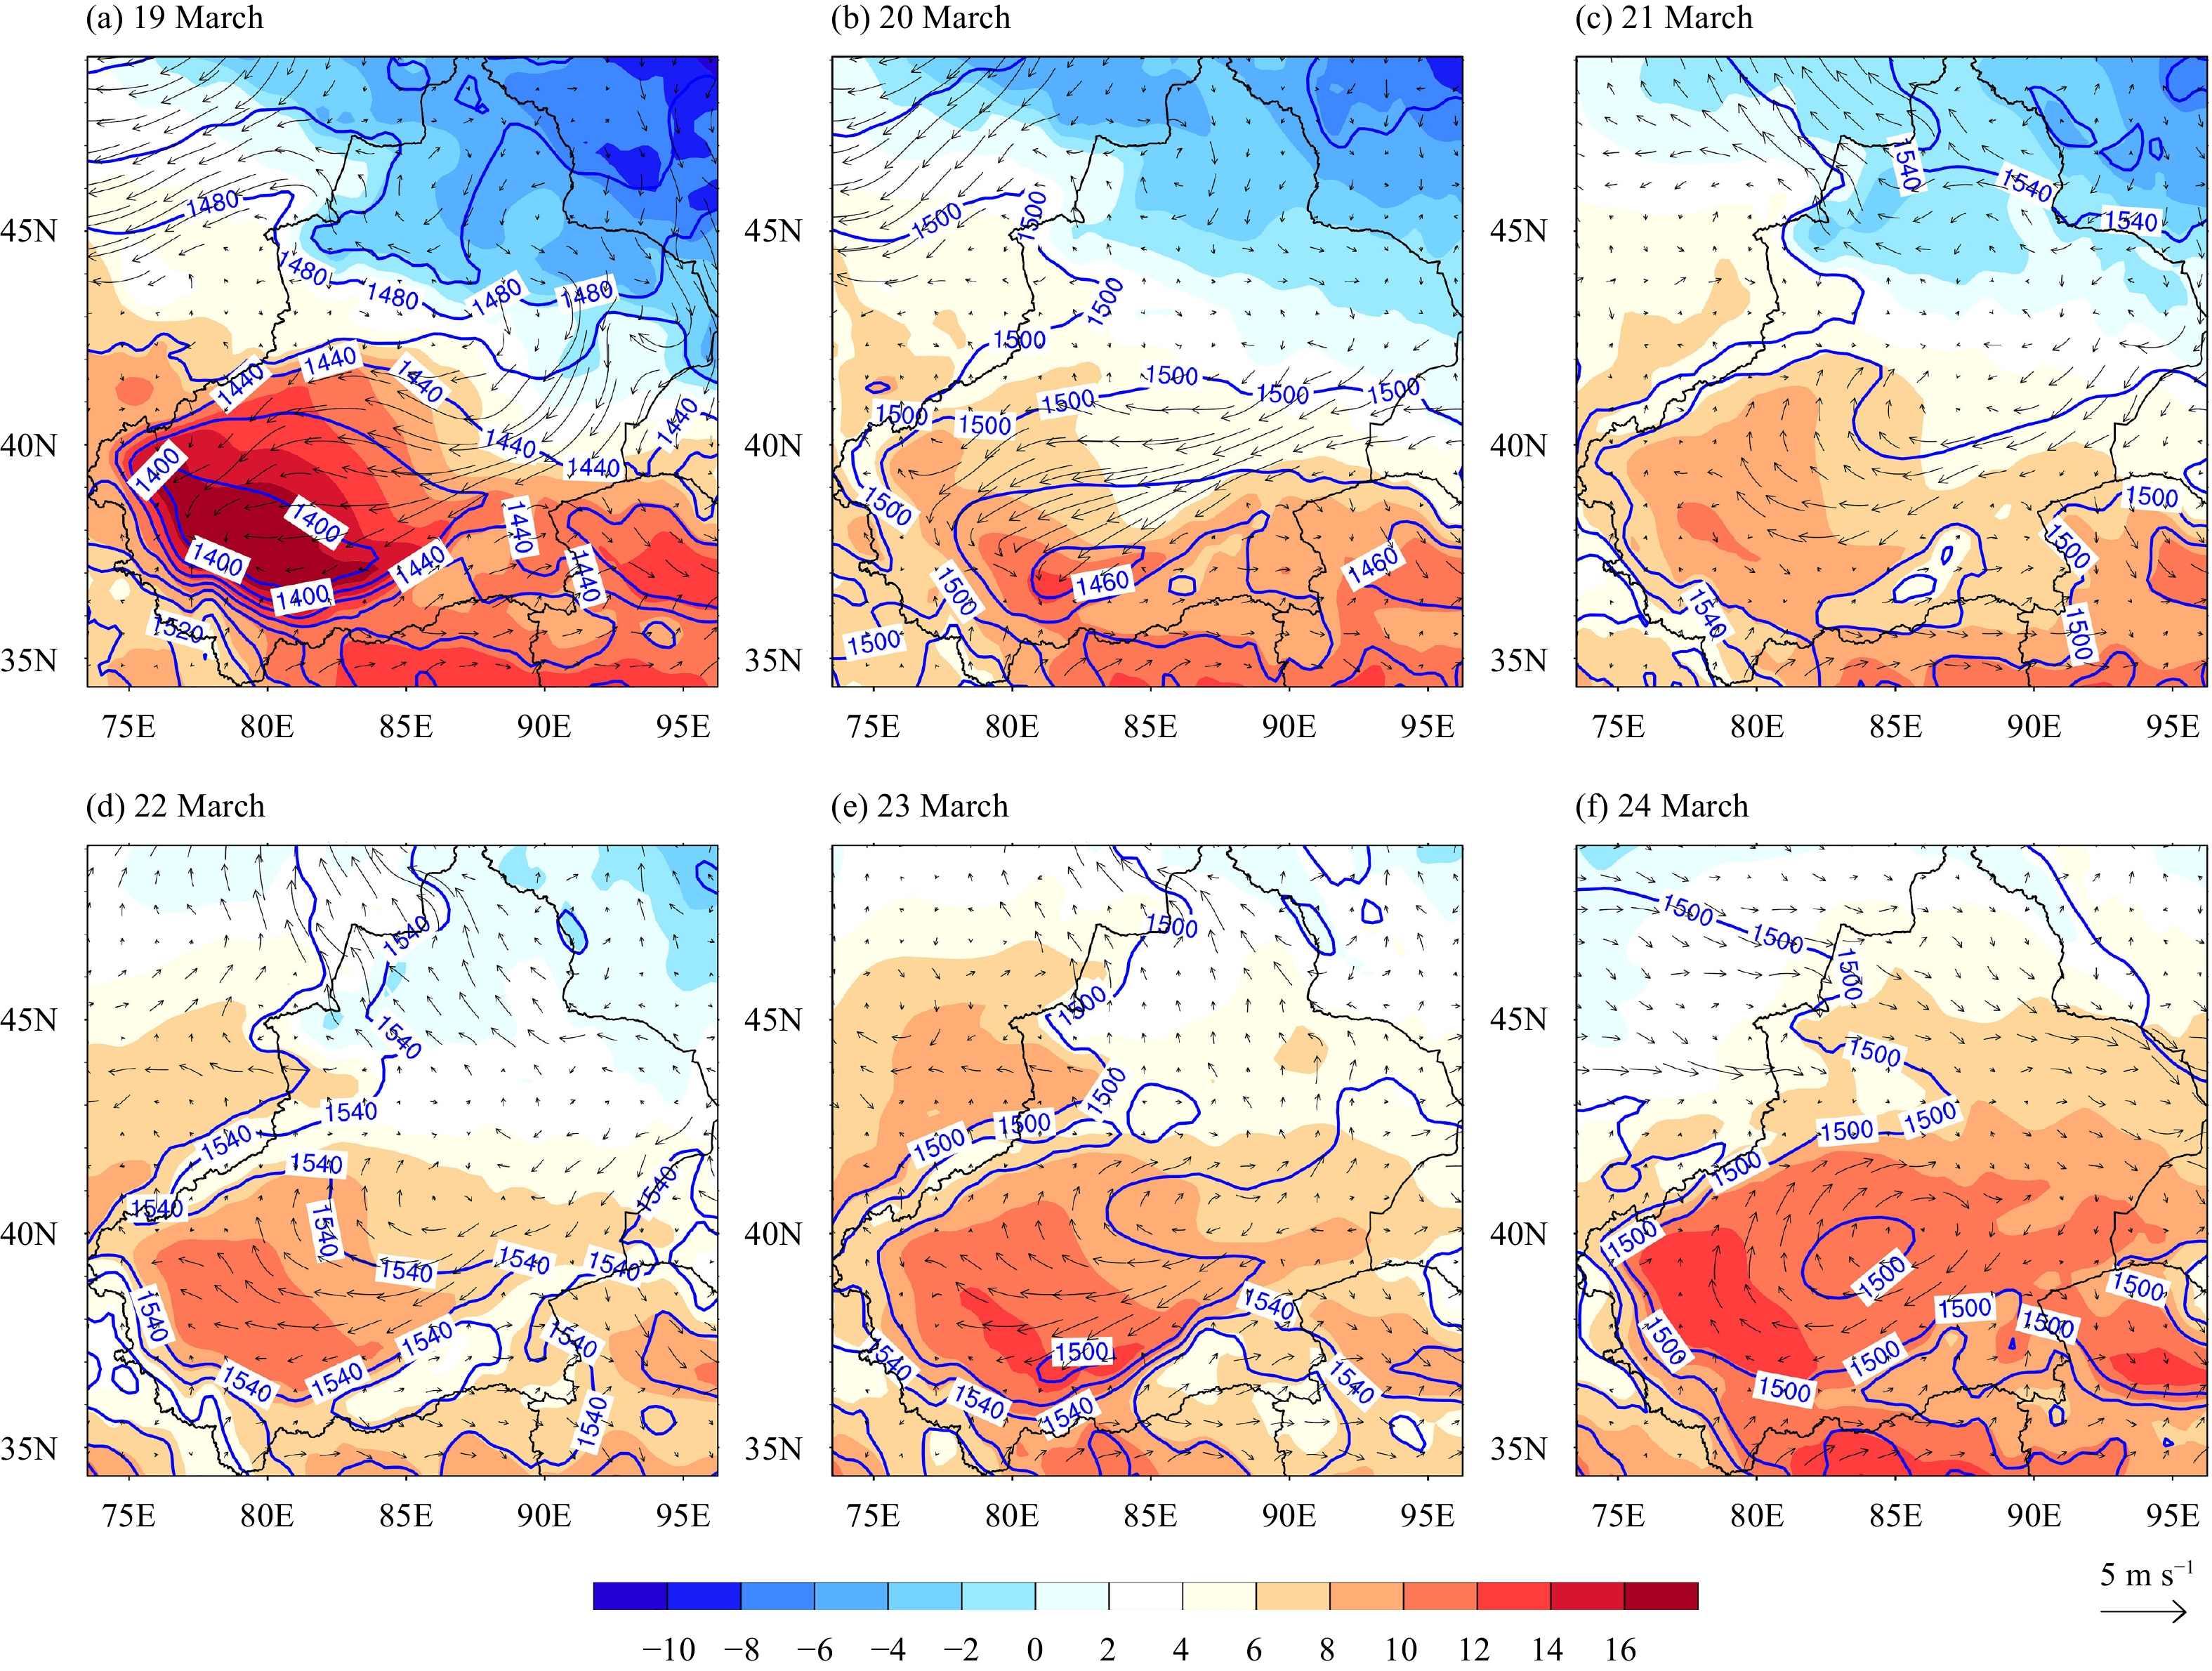
The source of dust in Xinjiang is stable, and the main meteorological factors that influence the transport of the dust are the speed and direction of wind (Che et al., 2019). In this study, we sought to analyze atmospheric circulation for the six days (19–24 March 2019) covering the selected dust event to determine the influence of the air mass movement on such an event. Figure 14 shows the weather pattern at 850 hPa during the dust storm. Initially, the dust air masses moved toward the Turpan and Hami areas under the influence of southeast winds of the Mongolian cyclone. Subsequently, however, the wind direction changed in Xinjiang under the influence of local topography, and thereafter, the dust air masses moved to southern Xinjiang along with the strong winds. During the dusting process, the meteorological conditions and topography in the study area provided favorable conditions for the collection and dispersion of dust, resulting in the accumulation and concentration of pollutants, which were important factors contributing to the comparatively prolonged duration of this dust event affecting Xinjiang.
Fig
14.
Spatiotemporal evolution of temperature (°C; shading), geopotential height (dagpm; blue contour), and total wind vectors (arrow; m s−1) at 850 hPa from 19 to 24 March 2019 over Northwest China.
4.
Conclusions and discussion
In this study, we assessed the impact of a dust storm event that occurred from 19 to 21 March 2019 in the Xinjiang region, and examined the three-dimensional spatiotemporal evolution of aerosols based on analyses of MODIS, CALIPSO, and ground-level air quality data. In addition, we also characterized the regional transport of aerosols in conjunction with the meteorological re-analysis data.
The MCD19A2 AOD data indicated that this dust episode probably persisted for six days in Xinjiang (19–24 March 2019), with increasing dust intensity and coverage over time. Peak dust activity was detected on 22 and 23 March, during which we recorded the highest aerosol optical depth values exceeding 3.5, in some time covering most regions of southern Xinjiang. In areas severely affected by dust, there were rapid increases in the concentrations of particulate matter and a corresponding sharp reduction in air quality, with PM10 being the main type of pollutant detected during this dust event.
Visualization of the vertical distribution of aerosols based on CALIPSO data indicated that the dust aerosol mainly accumulated in the troposphere at altitudes from 0 to 10 km. The distribution pattern was influenced to a large extent by the nature of the underlying surface. However, although we detected certain differences in the vertical distribution of aerosol optical properties, as a consequence of the presence of this dust event, the overall variation characteristics were broadly similar. We observed a reduction in the scattering ability of aerosols with increasing altitude, with the strongest and weakest scattering abilities being detected in the altitude ranges of 2–4 km and 8–10 km, respectively, thereby indicating that the aerosol pollution in dust-affected areas was primarily concentrated in the lower atmosphere. The size of aerosol particles in the lower atmosphere was found to be smaller than that at higher altitudes, and these particles were characterized by a more pronounced irregularity. In this regard, we speculate that the sparse vegetation cover and poor subsurface conditions of the terrain in Xinjiang contribute to a higher dispersion of large dust particles to high altitudes within a comparatively short period of time, thereby resulting in the higher color ratio values recorded in the upper atmosphere.
Under the influences of the Mongolian cyclone and the topography of Xinjiang, dust air masses were transported to Turpan, Hami, and most of the southern Xinjiang, causing accumulation and concentration of pollutants in the process, and contributing to a prolongation of the dust event in Xinjiang. Both meteorological conditions and topography are speculated to have played an important role in the duration of this pollution event.
The Xinjiang region of China is particularly prone to dust storms and is among the most severely affected areas, with one of the longest history of sand–salt dust storm disasters (Fan, 1996). The development of dust storms in this region is closely associated with land desertification and salinization. Dust storms occur frequently during the pre-monsoon season. Consequently, this region makes a considerable contribution to the aerosol load of central Asia (Zhang et al., 2003; Meng et al., 2020). Dust is transported from this region to downwind areas, such as the glaciers of the Tibetan Plateau, eastern Asia, and the entire Pacific Ocean, with the effects on air quality being recorded as far as North America (Huang et al., 2008; Liu et al., 2021). Our detailed analysis of the three-dimensional spatial distribution and transport characteristics of dust aerosols in the Xinjiang region during the dust storm will make a valuable contribution to enhancing our understanding of dust sources in Xinjiang and the impact of the dust on regional air quality. There is, however, a need to further quantify the impacts of aerosol emissions from dust events with respect to regional weather and climate change, based on model simulations and other methods, which will enable us to gain a more comprehensive understanding of the importance of the Xinjiang region in the global dust transport.
Acknowledgments
The authors would like to thank the editor and anonymous reviewers for their valuable comments and suggestions on this paper.
Fig.
13.
(a) Hourly average backward transport trajectories of air masses over four cities in Xinjiang during the dust event, and (b) hourly mean PM10 concentrations in the four cities.
Fig.
6.
Temporal evolution of the altitude–orbit distribution of dust subtypes during the dust storm event on (a) 20, (b) 21, (c) 22, and (d) 23 March 2019 (1 = Not Determined, 2 = Clean Marine, 3 = Dust, 4 = Polluted Continental, 5 = Clean Continental, 6 = Polluted Dust, 7 = Smoke, 8 = Dusty Marine, 9 = PSC Aerosol, 10 = Volcanic Ash, 11 = Sulfate/Other). Right panels are enlarged displays of the corresponding left panels. Boxes I, II, III, and IV in the right panels refer to the areas affected by the dust storm.
Fig.
14.
Spatiotemporal evolution of temperature (°C; shading), geopotential height (dagpm; blue contour), and total wind vectors (arrow; m s−1) at 850 hPa from 19 to 24 March 2019 over Northwest China.
Adams, A. M., J. M. Prospero, and C. D. Zhang, 2012: CALIPSO-derived three-dimensional structure of aerosol over the Atlantic Basin and adjacent continents. J. Climate, 25, 6862–6879. doi: 10.1175/JCLI-D-11-00672.1
Alizadeh-Choobari, O., A. Sturman, and P. Zawar-Reza, 2014: A global satellite view of the seasonal distribution of mineral dust and its correlation with atmospheric circulation. Dyn. Atmos. Oceans, 68, 20–34. doi: 10.1016/j.dynatmoce.2014.07.002
Behzad, H., K. Mineta, and T. Gojobori, 2018: Global ramifications of dust and sandstorm microbiota. Genome Biol. Evol., 10, 1970–1987. doi: 10.1093/gbe/evy134
Bi, J. R., J. P. Huang, B. Holben, et al., 2016: Comparison of key absorption and optical properties between pure and transported anthropogenic dust over East and Central Asia. Atmos. Chem. Phys., 16, 15,501–15,516. doi: 10.5194/acp-16-15501-2016
Bi, J. R., J. P. Huang, J. S. Shi, et al., 2017: Measurement of scattering and absorption properties of dust aerosol in a Gobi farmland region of northwestern China–a potential anthropogenic influence. Atmos. Chem. Phys., 17, 7775–7792. doi: 10.5194/acp-17-7775-2017
Che, H. Z., K. Gui, X. G. Xia, et al., 2019: Large contribution of meteorological factors to inter-decadal changes in regional aerosol optical depth. Atmos. Chem. Phys., 19, 10,497–10,523. doi: 10.5194/acp-19-10497-2019
Chen, G. B., S. S. Li, L. D. Knibbs, et al., 2018: A machine learning method to estimate PM2.5 concentrations across China with remote sensing, meteorological and land use information. Sci. Total Environ., 636, 52–60. doi: 10.1016/j.scitotenv.2018.04.251
Chen, X. Y., J. L. Ding, J. Z. Wang, et al., 2020: Retrieval of fine-resolution aerosol optical depth (AOD) in semiarid urban areas using Landsat data: A case study in Urumqi, NW China. Remote Sens., 12, 467. doi: 10.3390/rs12030467
Chen, X. Y., J. L. Ding, J. Liu, et al., 2021: Validation and comparison of high-resolution MAIAC aerosol products over Central Asia. Atmos. Environ., 251, 118273. doi: 10.1016/j.atmosenv.2021.118273
De Longueville, F., Y.-C. Hountondji, S. Henry, et al., 2010: What do we know about effects of desert dust on air quality and human health in West Africa compared to other regions? Sci. Total Environ., 409, 1–8. doi: 10.1016/j.scitotenv.2010.09.025
Di, A. J., Y. Xue, X. H. Yang, et al., 2016: Dust aerosol optical depth retrieval and dust storm detection for Xinjiang region using Indian national satellite observations. Remote Sens., 8, 702. doi: 10.3390/rs8090702
Dong, Q. Q., Z. W. Huang, W. R. Li, et al., 2022: Polarization lidar measurements of dust optical properties at the junction of the taklimakan desert–Tibetan Plateau. Remote Sens., 14, 558. doi: 10.3390/rs14030558
Draxler, R. R., and G. D. Hess, 1998: An overview of the HYSPLIT_4 modelling system for trajectories, dispersion, and deposition. Aust. Meteor. Mag., 47, 295–308.
Fan, Z. L., 1996: Research on the Impacts of Land Utilization to Ecology & Environment in Xinjiang and the Correspondent Countermeasures. China Meteorological Press, Beijing. (in Chinese)
Fernández, A. J., F. Molero, P. Salvador, et al., 2017: Aerosol optical, microphysical and radiative forcing properties during variable intensity African dust events in the Iberian Peninsula. Atmos. Res., 196, 129–141. doi: 10.1016/j.atmosres.2017.06.019
Ge, J. M., J. P. Huang, C. P. Xu, et al., 2014: Characteristics of Taklimakan dust emission and distribution: A satellite and reanalysis field perspective. J. Geophys. Res. Atmos., 119, 11,772–11,783. doi: 10.1002/2014JD022280
Ginoux, P., J. M. Prospero, O. Torres, et al., 2004: Long-term simulation of global dust distribution with the GOCART model: Correlation with North Atlantic Oscillation. Environ. Modell. Softw., 19, 113–128. doi: 10.1016/s1364-8152(03)00114-2
Gui, K., H. Z. Che, Z. L. Zeng, et al., 2020: Construction of a virtual PM2.5 observation network in China based on high-density surface meteorological observations using the Extreme Gradient Boosting model. Environ. Int., 141, 105801. doi: 10.1016/j.envint.2020.105801
Han, Z. W., H. Ueda, K. Matsuda, et al., 2004: Model study on particle size segregation and deposition during Asian dust events in March 2002. J. Geophys. Res. Atmos., 109, D19205. doi: 10.1029/2004jd004920
Huang, J. P., P. Minnis, B. Chen, et al., 2008: Long-range transport and vertical structure of Asian dust from CALIPSO and surface measurements during PACDEX. J. Geophys. Res. Atmos., 113, D23212. doi: 10.1029/2008JD010620
Huige, D., L. Siwen, Y. Yun, et al., 2021: Observational study of the vertical aerosol and meteorological factor distributions with respect to particulate pollution in Xi’an. Atmos. Environ., 247, 118215. doi: 10.1016/j.atmosenv.2021.118215
Jia, R., Y. Z. Liu, S. Hua, et al., 2018: Estimation of the aerosol radiative effect over the Tibetan Plateau based on the latest CALIPSO product. J. Meteor. Res., 32, 707–722. doi: 10.1007/s13351-018-8060-3
Jin, X. Y., J. L. Ding, X. Y. Ge, et al., 2022: Machine learning driven by environmental covariates to estimate high-resolution PM2.5 in data-poor regions. PeerJ, 10, e13203. doi: 10.7717/peerj.13203
Kang, L. T., S. Y. Chen, J. P. Huang, et al., 2017: The spatial and temporal distributions of absorbing aerosols over East Asia. Remote Sens., 9, 1050. doi: 10.3390/rs9101050
Kim, J., S. H. Choi, H. K. Cho, et al., 2004. Aerosol and CO loading in the atmosphere observed by the MODIS and MOPITT: Russian forest fire case. Proc. SPIE 5652, Passive Optical Remote Sensing of the Atmosphere and Clouds IV, SPIE, Honolulu, USA, 263–269, doi: 10.1117/12.578903.
Kok, J. F., D. A. Ridley, Q. Zhou, et al., 2017: Smaller desert dust cooling effect estimated from analysis of dust size and abundance. Nat. Geosci., 10, 274–278. doi: 10.1038/ngeo2912
Levy, R. C., S. Mattoo, L. A. Munchak, et al., 2013: The Collection 6 MODIS aerosol products over land and ocean. Atmos. Meas. Tech., 6, 2989–3034. doi: 10.5194/amt-6-2989-2013
Li, J. L., Q. He, X. Y. Ge, et al., 2021: Spatio-temporal changes of AOD in Xinjiang of China from 2000 to 2019: Which factor is more influential, natural factor or human factor? PLoS One, 16, e0253942. doi: 10.1371/journal.pone.0253942
Liao, T. T., K. Gui, Y. F. Li, et al., 2021: Seasonal distribution and vertical structure of different types of aerosols in southwest China observed from CALIOP. Atmos. Environ., 246, 118145. doi: 10.1016/j.atmosenv.2020.118145
Liu, J., J. L. Ding, L. Li, et al., 2020: Characteristics of aerosol optical depth over land types in central Asia. Sci. Total Environ., 727, 138676. doi: 10.1016/j.scitotenv.2020.138676
Liu, J., J. L. Ding, M. Rexiding, et al., 2021: Characteristics of dust aerosols and identification of dust sources in Xinjiang, China. Atmos. Environ., 262, 118651. doi: 10.1016/j.atmosenv.2021.118651
Liu, J. J., Y. F. Zheng, Z. Q. Li, et al., 2012: Seasonal variations of aerosol optical properties, vertical distribution and associated radiative effects in the Yangtze Delta region of China. J. Geophys. Res. Atmos., 117, D00K38. doi: 10.1029/2011JD016490
Liu, Y., L. H. Li, X. Chen, et al., 2018: Temporal-spatial variations and influencing factors of vegetation cover in Xinjiang from 1982 to 2013 based on GIMMS-NDVI3g. Global Planet. Change, 169, 145–155. doi: 10.1016/j.gloplacha.2018.06.005
Liu, Z., D. Liu, J. Huang, et al., 2008: Airborne dust distributions over the Tibetan Plateau and surrounding areas derived from the first year of CALIPSO lidar observations. Atmos. Chem. Phys., 8, 5045–5060. doi: 10.5194/acp-8-5045-2008
Liu, Z. Y., A. Omar, M. Vaughan, et al., 2008: CALIPSO lidar observations of the optical properties of Saharan dust: A case study of long-range transport. J. Geophys. Res. Atmos., 113, D07207. doi: 10.1029/2007jd008878
Mahowald, N., S. Albani, J. F. Kok, et al., 2014: The size distribution of desert dust aerosols and its impact on the Earth system. Aeolian Res., 15, 53–71. doi: 10.1016/j.aeolia.2013.09.002
Marinescu, P. J., S. C. van den Heever, S. M. Saleeby, et al., 2017: The microphysical roles of lower-tropospheric versus midtropospheric aerosol particles in mature-stage MCS precipitation. J. Atmos. Sci., 74, 3657–3678. doi: 10.1175/JAS-D-16-0361.1
Meng, L., X. H. Yang, T. L. Zhao, et al., 2020: Simulated regional transport structures and budgets of dust aerosols during a typical springtime dust storm in the Tarim Basin, Northwest China. Atmos. Res., 238, 104892. doi: 10.1016/j.atmosres.2020.104892
Mhawish, A., T. Banerjee, M. Sorek-Hamer, et al., 2019: Comparison and evaluation of MODIS multi-angle implementation of atmospheric correction (MAIAC) aerosol product over South Asia. Remote Sens. Environ., 224, 12–28. doi: 10.1016/j.rse.2019.01.033
Nabavi, S. O., L. Haimberger, and E. Abbasi, 2019: Assessing PM2.5 concentrations in Tehran, Iran, from space using MAIAC, deep blue, and dark target AOD and machine learning algorithms. Atmos. Pollut. Res., 10, 889–903. doi: 10.1016/j.apr.2018.12.017
Olauson, J., 2018: ERA5: The new champion of wind power modelling? Renew. Energy, 126, 322–331. doi: 10.1016/j.renene.2018.03.056
Perrone, M. R., S. Romano, and J. A. G. Orza, 2015: Columnar and ground-level aerosol optical properties: Sensitivity to the transboundary pollution, daily and weekly patterns, and relationships. Environ. Sci. Pollut. Res., 22, 16,570–16,589. doi: 10.1007/s11356-015-4850-7
Qi, Y. L., J. M. Ge, and J. P. Huang, 2013: Spatial and temporal distribution of MODIS and MISR aerosol optical depth over northern China and comparison with AERONET. Chinese Sci. Bull., 58, 2497–2506. doi: 10.1007/s11434-013-5678-5
Querol, X., A. Tobías, N. Pérez, et al., 2019: Monitoring the impact of desert dust outbreaks for air quality for health studies. Environ. Int., 130, 104867. doi: 10.1016/j.envint.2019.05.061
Rupakheti, D., X. F. Yin, M. Rupakheti, et al., 2021: Spatio-temporal characteristics of air pollutants over Xinjiang, northwestern China. Environ. Pollut., 268, 115907. doi: 10.1016/j.envpol.2020.115907
Samset, B. H., G. Myhre, M. Schulz, et al., 2013: Black carbon vertical profiles strongly affect its radiative forcing uncertainty. Atmos. Chem. Phys., 13, 2423–2434. doi: 10.5194/acp-13-2423-2013
Sarkar, S., A. Chauhan, R. Kumar, et al., 2019: Impact of deadly dust storms (May 2018) on air quality, meteorological, and atmospheric parameters over the northern parts of India. GeoHealth, 3, 67–80. doi: 10.1029/2018gh000170
Shao, Y. P., K.-H. Wyrwoll, A. Chappell, et al., 2011: Dust cycle: An emerging core theme in Earth system science. Aeolian Res., 2, 181–204. doi: 10.1016/j.aeolia.2011.02.001
Shen, Y. J., Y. J. Shen, Y. Guo, et al., 2020: Review of historical and projected future climatic and hydrological changes in mountainous semiarid Xinjiang (northwestern China), central Asia. CATENA, 187, 104343. doi: 10.1016/j.catena.2019.104343
Takamura, T., N. Sugimoto, A. Shimizu, et al., 2007: Aerosol radiative characteristics at Gosan, Korea, during the atmospheric brown cloud East Asian regional experiment 2005. J. Geophys. Res. Atmos., 112, D22S36. doi: 10.1029/2007jd008506
Turap, Y., D. Talifu, X. M. Wang, et al., 2019: Temporal distribution and source apportionment of PM2.5 chemical composition in Xinjiang, NW-China. Atmos. Res., 218, 257–268. doi: 10.1016/j.atmosres.2018.12.010
Wang, J. Y., S. X. Su, Z. L. Yin, et al., 2022: Quantitatively assessing the contributions of dust aerosols to direct radiative forcing based on remote sensing and numerical simulation. Remote Sens., 14, 660. doi: 10.3390/rs14030660
Wang, S. J., M. J. Zhang, M. P. Sun, et al., 2015: Comparison of surface air temperature derived from NCEP/DOE R2, ERA-Interim, and observations in the arid northwestern China: A consideration of altitude errors. Theor. Appl. Climatol., 119, 99–111. doi: 10.1007/s00704-014-1107-1
Wang, W., A. Samat, J. Abuduwaili, et al., 2020: Spatio-temporal variations of satellite-based PM2.5 concentrations and its determinants in Xinjiang, northwest of China. Int. J. Environ. Res. Public Health, 17, 2157. doi: 10.3390/ijerph17062157
Wang, Z. M., R. Abla, W. Y. Feng, et al., 2019: Analysis of aerosol optical properties on different underlying surfaces in Xinjiang. J. Glaciol. Geocryol., 41, 1367–1376. (in Chinese) doi: 10.7522/j.issn.1000-0240.2019.0087
Winker, D. M., J. R. Pelon, and M. P. McCormick, 2003. The CALIPSO mission: Spaceborne lidar for observation of aerosols and clouds. Proc. SPIE 4893, Lidar Remote Sensing for Industry and Environment Monitoring III, SPIE, Hangzhou, China, 1–11, doi: 10.1117/12.466539.
Winker, D. M., W. H. Hunt, and M. J. McGill, 2007: Initial performance assessment of CALIOP. Geophys. Res. Lett., 34, L19803. doi: 10.1029/2007gl030135
Xu, X. F., H. Wu, X. Y. Yang, et al., 2020: Distribution and transport characteristics of dust aerosol over Tibetan Plateau and Taklimakan Desert in China using MERRA-2 and CALIPSO data. Atmos. Environ., 237, 117670. doi: 10.1016/j.atmosenv.2020.117670
Yang, F., J. P. Huang, C. L. Zhou, et al., 2020: Taklimakan desert carbon-sink decreases under climate change. Sci. Bull., 65, 431–433. doi: 10.1016/j.scib.2019.12.022
Yin, X. F., B. de Foy, K. P. Wu, et al., 2019: Gaseous and particulate pollutants in Lhasa, Tibet during 2013–2017: Spatial variability, temporal variations and implications. Environ. Pollut., 253, 68–77. doi: 10.1016/j.envpol.2019.06.113
Zhang, X. T., K. Gui, T. T. Liao, et al., 2021: Three-dimensional spatiotemporal evolution of wildfire-induced smoke aerosols: A case study from Liangshan, Southwest China. Sci. Total Environ., 762, 144586. doi: 10.1016/j.scitotenv.2020.144586
Zhang, X. Y., S. L. Gong, T. L. Zhao, et al., 2003: Sources of Asian dust and role of climate change versus desertification in Asian dust emission. Geophys. Res. Lett., 30, 2272. doi: 10.1029/2003GL018206
Zhang, Z. C., Z. B. Dong, C. X. Zhang, et al., 2017: The geochemical characteristics of dust material and dust sources identification in northwestern China. J. Geochem. Exp., 175, 148–155. doi: 10.1016/j.gexplo.2016.11.006
Zhang, Z. Y., W. L. Wu, M. Fan, et al., 2019: Evaluation of MAIAC aerosol retrievals over China. Atmos. Environ., 202, 8–16. doi: 10.1016/j.atmosenv.2019.01.013
Xu, M. Z., J. L. Ding, J. Liu, et al., 2023: Vertical distribution and transport of aerosols during a dust event in Xinjiang, Northwest China. J. Meteor. Res., 37(3), 387–403, doi: 10.1007/s13351-023-2148-0.
Xu, M. Z., J. L. Ding, J. Liu, et al., 2023: Vertical distribution and transport of aerosols during a dust event in Xinjiang, Northwest China. J. Meteor. Res., 37(3), 387–403, doi: 10.1007/s13351-023-2148-0.
Xu, M. Z., J. L. Ding, J. Liu, et al., 2023: Vertical distribution and transport of aerosols during a dust event in Xinjiang, Northwest China. J. Meteor. Res., 37(3), 387–403, doi: 10.1007/s13351-023-2148-0.
Citation:
Xu, M. Z., J. L. Ding, J. Liu, et al., 2023: Vertical distribution and transport of aerosols during a dust event in Xinjiang, Northwest China. J. Meteor. Res., 37(3), 387–403, doi: 10.1007/s13351-023-2148-0.
Export: BibTexEndNote
Article Metrics
Article views: 982 PDF downloads: 45Cited by:
Manuscript History
Received: 17 October 2022
Revised: 10 January 2023
Accepted: 05 February 2023
Available online: 06 February 2023
Final form: 20 February 2023
Typeset Proofs: 09 March 2023
Issue in Progress: 27 April 2023
Published online: 19 June 2023
Share
Catalog
Abstract
摘要
1.
Introduction
2.
Data and methods
2.1
The study region
2.2
MODIS AOD data
2.3
Ground-based air quality
2.4
CALIPSO
2.5
ERA-5 reanalysis data
2.6
Back trajectory analysis
3.
Results and analysis
3.1
Dust event identification
3.2
Variation in PM concentration during the dust event
3.3
Vertical distribution of aerosol optical properties


 Download: