Supported by the National Natural Science Foundation of China (41705026, U1433202, 41875056, and 91437215), Key Laboratory of South China Sea Meteorological Disaster Prevention and Mitigation of Hainan Province (SCSF201801), and Special Key Project of Chongqing Technology Innovation and Application Development (cstc2019jscx-tjsbX0007)
Organized warm-sector rainfall (OWSR) near the coast of South China tends to occur in certain synoptic situations characterized with either a low-level jet or an anticyclone, with the latter being less investigated. This paper fills the gap by analyzing 15 OWSR events that occurred in an anticyclone synoptic situation during the pre-summer rainy season of 2011–2016, based on high-resolution observational and reanalysis data. The results show that the anticy-clone synoptic situation produces marked northerly boundary-layer winds inland and obvious northeasterly, easterly/southwesterly, and southeasterly boundary-layer winds near the coasts of eastern Guangdong, western Guangdong, and Guangxi, respectively. The coastal boundary-layer winds promote favorable environmental conditions and strong convergence for convection initiation; consequently, OWSR is prone to occur near the coasts of western Guangdong and Guangxi, but exhibits different formation and propagation features in the following two sub-areas. (1) The southeasterly boundary-layer winds tend to converge near the border area between Guangxi and Guangdong (BGG), promoting the formation of a stable convective line along the mountains. The convective line persists with support of upper-level southwesterly winds that facilitate convective cells to propagate along the convective line, producing heavy OWSR along the mountains near BGG. (2) In contrast, a west–east convective line tends to form and maintain near the coast of Yangjiang (YJ) area, about 200 km east of BGG, owing to stable convergence between the easterly (or southwesterly) and the northerly boundary-layer winds reinforced by the mountains near YJ. Moreover, the coupling of upper-level westerly winds with the easterly (southwesterly) boundary-layer winds facilitates expansion (eastward propagation) of the convective line, causing west–east-oriented heavy OWSR near the coast of YJ. In a word, this study reveals refined properties of OWSR initiation and development in the anticyclone synoptic situation, which may help improve the forecast skill of OWSR during the pre-summer rainy season in South China.
The pre-summer season (April−June) rainfall over South China is generally divided into frontal rainfall and warm-sector rainfall (Zhao et al., 2007; Luo et al., 2017; Chen et al., 2018). The frontal rainfall, also known as the Meiyu front rainfall, is caused by the mesoscale convective systems related to a quasi-stationary front (Zhao et al., 2007; Du and Chen, 2018), whereas the warm-sector rainfall forms in the warm sector a few hundred kilometers from the front (Huang, 1986; Ding, 1994). Field experiments conducted in South China (Huang, 1986; Zhou et al., 2003; Zhang et al., 2011; Ni et al., 2013; Luo et al., 2017) have shown that the extraordinary rainstorms that lead to various serious disasters generally occur in the warm sector. However, because of the absence of an apparent synoptic-scale boundary, it is difficult to determine the location and evolution of warm-sector heavy rainfall (Du and Chen, 2018). Thus, relatively poor skill is shown in the forecasts of warm-sector heavy rainfall (He et al., 2016). In view of this, considerable efforts have been devoted to improving the forecasts of warm-sector rainstorms in South China, via the introduction of uncertainties to ensemble forecasts (Huang and Luo, 2017; Zhang, 2018, 2019), modification of the physics parameterization of models (Furtado et al., 2018, 2020; Qian et al., 2018) , and data assimilation of high-resolution radar observations (Zhang et al., 2016; Bao et al., 2017).
One primary cause of the poor forecasting skill for the warm-sector rainfall is the difficulty in capturing the initiation of warm-sector rainfall systems, which are influenced by diverse factors, including underlying surface features such as the land–sea thermal contrast (Chen et al., 2016), topography (Wang et al., 2014), and the urban heat island effect (Huang et al., 2019; Wu et al., 2019); mesoscale or boundary-layer systems such as low-level and boundary-layer jets (Lin, 2006; Du and Rotunno, 2018; Du and Chen, 2019; Du et al., 2020a), cold outflow boundaries (Liu et al., 2018; Huang et al., 2019), land–sea breeze fronts (Birch et al., 2015; Chen et al., 2017), and gravity waves (Xu et al., 2013); and the diurnal cycle (Du and Chen, 2019). Many of these factors, such as the urban heat island effect, the boundary-layer jet, the cold pool, and the land–sea breeze, are not well resolved by models. The trigger mechanisms of warm-sector rainstorms become more complicated when multiple factors interact with each other. The inland southwesterly low-level jet that approaches the boundary-layer jet over the northern South China Sea can lead to overlap of their ascending locations, which greatly promotes the initiation of warm-sector rainfall (Zhong and Chen, 2017; Du and Chen, 2018, 2019). Furthermore, the effects of the frictional difference between the land and sea and the uplift of coastal mountains on the winds are amplified when the strong winds associated with a low-level jet or boundary-layer jet advance to the coastal region from the sea, which is a main cause of the occurrence of coastal warm-sector rainfall (Chen et al., 2014, 2017; Du et al., 2020b). Coastal topography also affects the moisture convergence distribution and cold pool motion, which consequently influences the initiation and subsequent evolution of rainfall systems (Du et al., 2020b). The thermally driven orographic circulation associated with the mountains near the coastline can enhance sea-breeze circulation, thereby promoting the initiation of coastal rainfall systems (Darby et al., 2002; Barthlott and Kirshbaum, 2013; Li and Carbone, 2015). In addition, a conceptual model depicting how a combined process of terrain uplift, land–sea frictional difference, warm boundary-layer advection, and cold outflow boundary promotes a mesoscale convective system that produces extreme rainfall has also been found to be applicable in many extreme warm-sector rainfall events in the coastal region of South China (Wang et al., 2014; Wu and Luo, 2016; Liu et al., 2018).
The difficulty in accurately capturing the evolution of the cold pool and environmental conditions, which play important roles in determining the orientations and detailed structures of mesoscale convective systems (Cheng, 2005a, b), is another key factor leading to the poor forecasting skill for warm-sector rainfall. Statistical analysis has indicated that the warm-sector rainfall systems in South China in the pre-summer rainy season often organize into the shape of lines or long stripes (Liang et al., 2012). Studies of the classical organizational modes favorable for quasi-linear convective systems (Bluestein and Jain, 1985; Parker and Johnson, 2000; Schumacher and Johnson, 2005), including different combinations of a convective line and stratus, and stagnation or backward development of convective lines, have shown that these organizational modes occur in appropriate environmental conditions. Vertical wind shear is one of the key environmental conditions affecting the organizational modes of a convective system through its interaction with the outflow in a parallel or perpendicular direction (Rotunno et al., 1988; Weisman et al., 1988; Weisman and Rotunno, 2004; Parker, 2007).
A number of studies (Mu et al., 2008; Wang et al., 2014) have found an organizational mode of warm-sector rainfall systems called “cell training” or “band training” in Guangdong in South China, which promotes the occurrence of extreme warm-sector rainfall (Doswell III et al., 1996; Davis, 2001). However, the type of synoptic situation that is conducive to this organizational mode of warm-sector rainfall systems has not been determined. Moreover, there is a substantial difference in the characteristics of the warm-sector rainfall distribution between Guangxi and Guangdong in terms of the diurnal evolution of the pre-summer rainy season rainfall over South China (Jiang et al., 2017). In addition to local forcings, such as the topography and coastline, it is worth exploring whether the organizational processes of warm-sector rainfall systems and their influential synoptic situations over these two provinces have a notable effect on the formation of these differences. In view of this, the characteristic synoptic situations for the organized warm-sector rainfall (OWSR; defined in Section 2) near the coast of South China (covering Guangdong and Guangxi) in the pre-summer rainy season were determined recently (Liang et al., 2019). The coastal OWSR in South China generally occurs in the synoptic situation characterized by (1) a prominent southwesterly low-level jet (SWLLJ) over South China and a marked boundary-layer jet over the northern South China Sea, or (2) a substantial low-level anticyclone (ACR: anticyclone regime) over the Yangtze River basin without a low-level jet present over South China. A marked surface low occurs in southwestern China in the SWLLJ situation, leading to strong southwesterly winds prevailing near the surface, while a prominent surface high forms in central China in the ACR situation, bringing substantial easterly winds near the coast of South China and northerly winds inland. The effects of the SWLLJ situation on the occurrence of OWSR have been reported by many studies (Chen et al., 2014, 2017; Zhong and Chen, 2017; Du and Chen, 2018, 2019). In contrast, the role of the ACR situation in the occurrence of OWSR has not been particularly discussed. Furthermore, the OWSR in the ACR situation tends to occur in two adjacent coastal regions—the border area between Guangxi and Guangdong (BGG), and the Yangjiang (YJ) area in western Guangdong—and shows a notable regional difference in rainfall distribution (Liang et al., 2019), the cause of which remains unclear.
Given these deficiencies, this study aims to understand the formation and regional difference of the OWSR in South China in the ACR situation. For this purpose, the OWSR events occurring near the coast of South China in the ACR situation in recent years are investigated, via observational analysis of high-resolution surface, radiosonde, and radar data. In Section 2, the data and methodology are briefly introduced. The key factor of the ACR situation causing the formation of OWSR is analyzed in Section 3. Then, the effects of the key factor on the trigger and propagation processes of OWSR systems, as well as their regional differences, are investigated in Sections 4 and 5, respectively. Finally, conclusions and discussion are presented in Section 5.
2.
Data and methodology
The high-resolution observational data from the China Meteorological Administration (CMA), including surface, radiosonde, and radar data, are used for the analysis in this study. The surface data are provided by the automatic surface stations mainly covering Guangdong and Guangxi and the surrounding sea area (the gray dots in Fig. 1a) and have been quality controlled through the checks of climatic range and internal, temporal, and spatial consistencies (Ren et al., 2015). The data are at 1-h intervals, and interpolated onto 0.05° × 0.05° grid points by using the Cressman objective analysis method (Cressman, 1959), including observations of rainfall and near-surface wind and temperature. The near-surface winds and temperatures are utilized to analyze wind vectors, convergence lines, and thermal conditions associated with the trigger of OWSR systems, and the hourly surface rainfall is used to identify the OWSR events. The L-band radiosonde stations in South China (see rectangles in Fig. 1a) provide profiles of basic parameters, including wind, humidity, temperature, and pressure. These profiles are resampled at 50-m vertical resolution and are available at 0800 and 2000 BT (Beijing Time). The pseudo-equivalent potential temperature profile, convective available potential energy (CAPE), and free convection level (LFC) are then calculated and used to support analysis of the environmental conditions for the OWSR in the ACR situation, together with the basic parameter profiles.
Fig
1.
(a) Distribution of surface (gray dots), radiosonde (black rectangles), and radar (black filled circles) stations in Guangxi (GX) and Guangdong (GD) in South China. (b) Distribution of orography (gray shading; m) near the border area between Guangxi and Guangdong (BGG) and the Yangjiang (YJ) area in western Guangdong. The numbers such as “59431” in (a) denote radiosonde station IDs, and the thick lines in (b) outline the mountain ranges.
Furthermore, reflectivity data from 10 radar stations in Guangdong and Guangxi (the black filled circles in Fig. 1a) are collected to produce combined radar reflectivity mosaics at 0.5-h intervals for analysis of the evolution of convective systems in each OWSR event, utilizing the software provided by Wang et al. (2009). The reflectivity data of each radar is first quality controlled by eliminating ground clutter, signal interference, and noise. Then, the reflectivity data of all radars are interpolated into a spatial grid with a uniform resolution (0.01° × 0.01°), and combined primarily by processing the reflectivity within the overlap areas of the radars. In addition, the radar radial wind speeds provided by the radar stations near BGG and YJ are utilized to analyze low-level convergence lines, as the observation of near-surface winds over the sea is absent. In addition, wind from the hourly ECMWF reanalysis dataset (Hersbach and Dee, 2016) is used to analyze the propagation processes of OWSR systems. The horizontal resolution of this dataset is 0.25° × 0.25°, and in the vertical, 23 pressure levels from 1000 to 200 hPa are applied.
A total of 15 OWSR events occurring in the ACR situation (7 over BGG and 8 in YJ, respectively) during April–June (pre-summer rainy season) of 2011–2016 are used for the analysis. The occurrence dates of these events are shown in Table 1. These OWSR events are taken from a previous study (Liang et al., 2019), in which an OWSR event is defined as when rainfall greater than 2 mm h−1 occurs at least at three adjacent stations in a coastal region (within about 100 km or 1° latitude from the coastline), and the area of rainfall greater than 2 mm h−1 stays or propagates in the warm sector (where no marked northerly winds with colder temperatures are shown) for more than 3 h before dissipating, with a 12-h accumulated rainfall center greater than 30 mm.
Table
1.
Occurrence dates of the OWSR events near BGG and YJ in the ACR situation during April–June (pre-summer rainy season) of 2011–2016
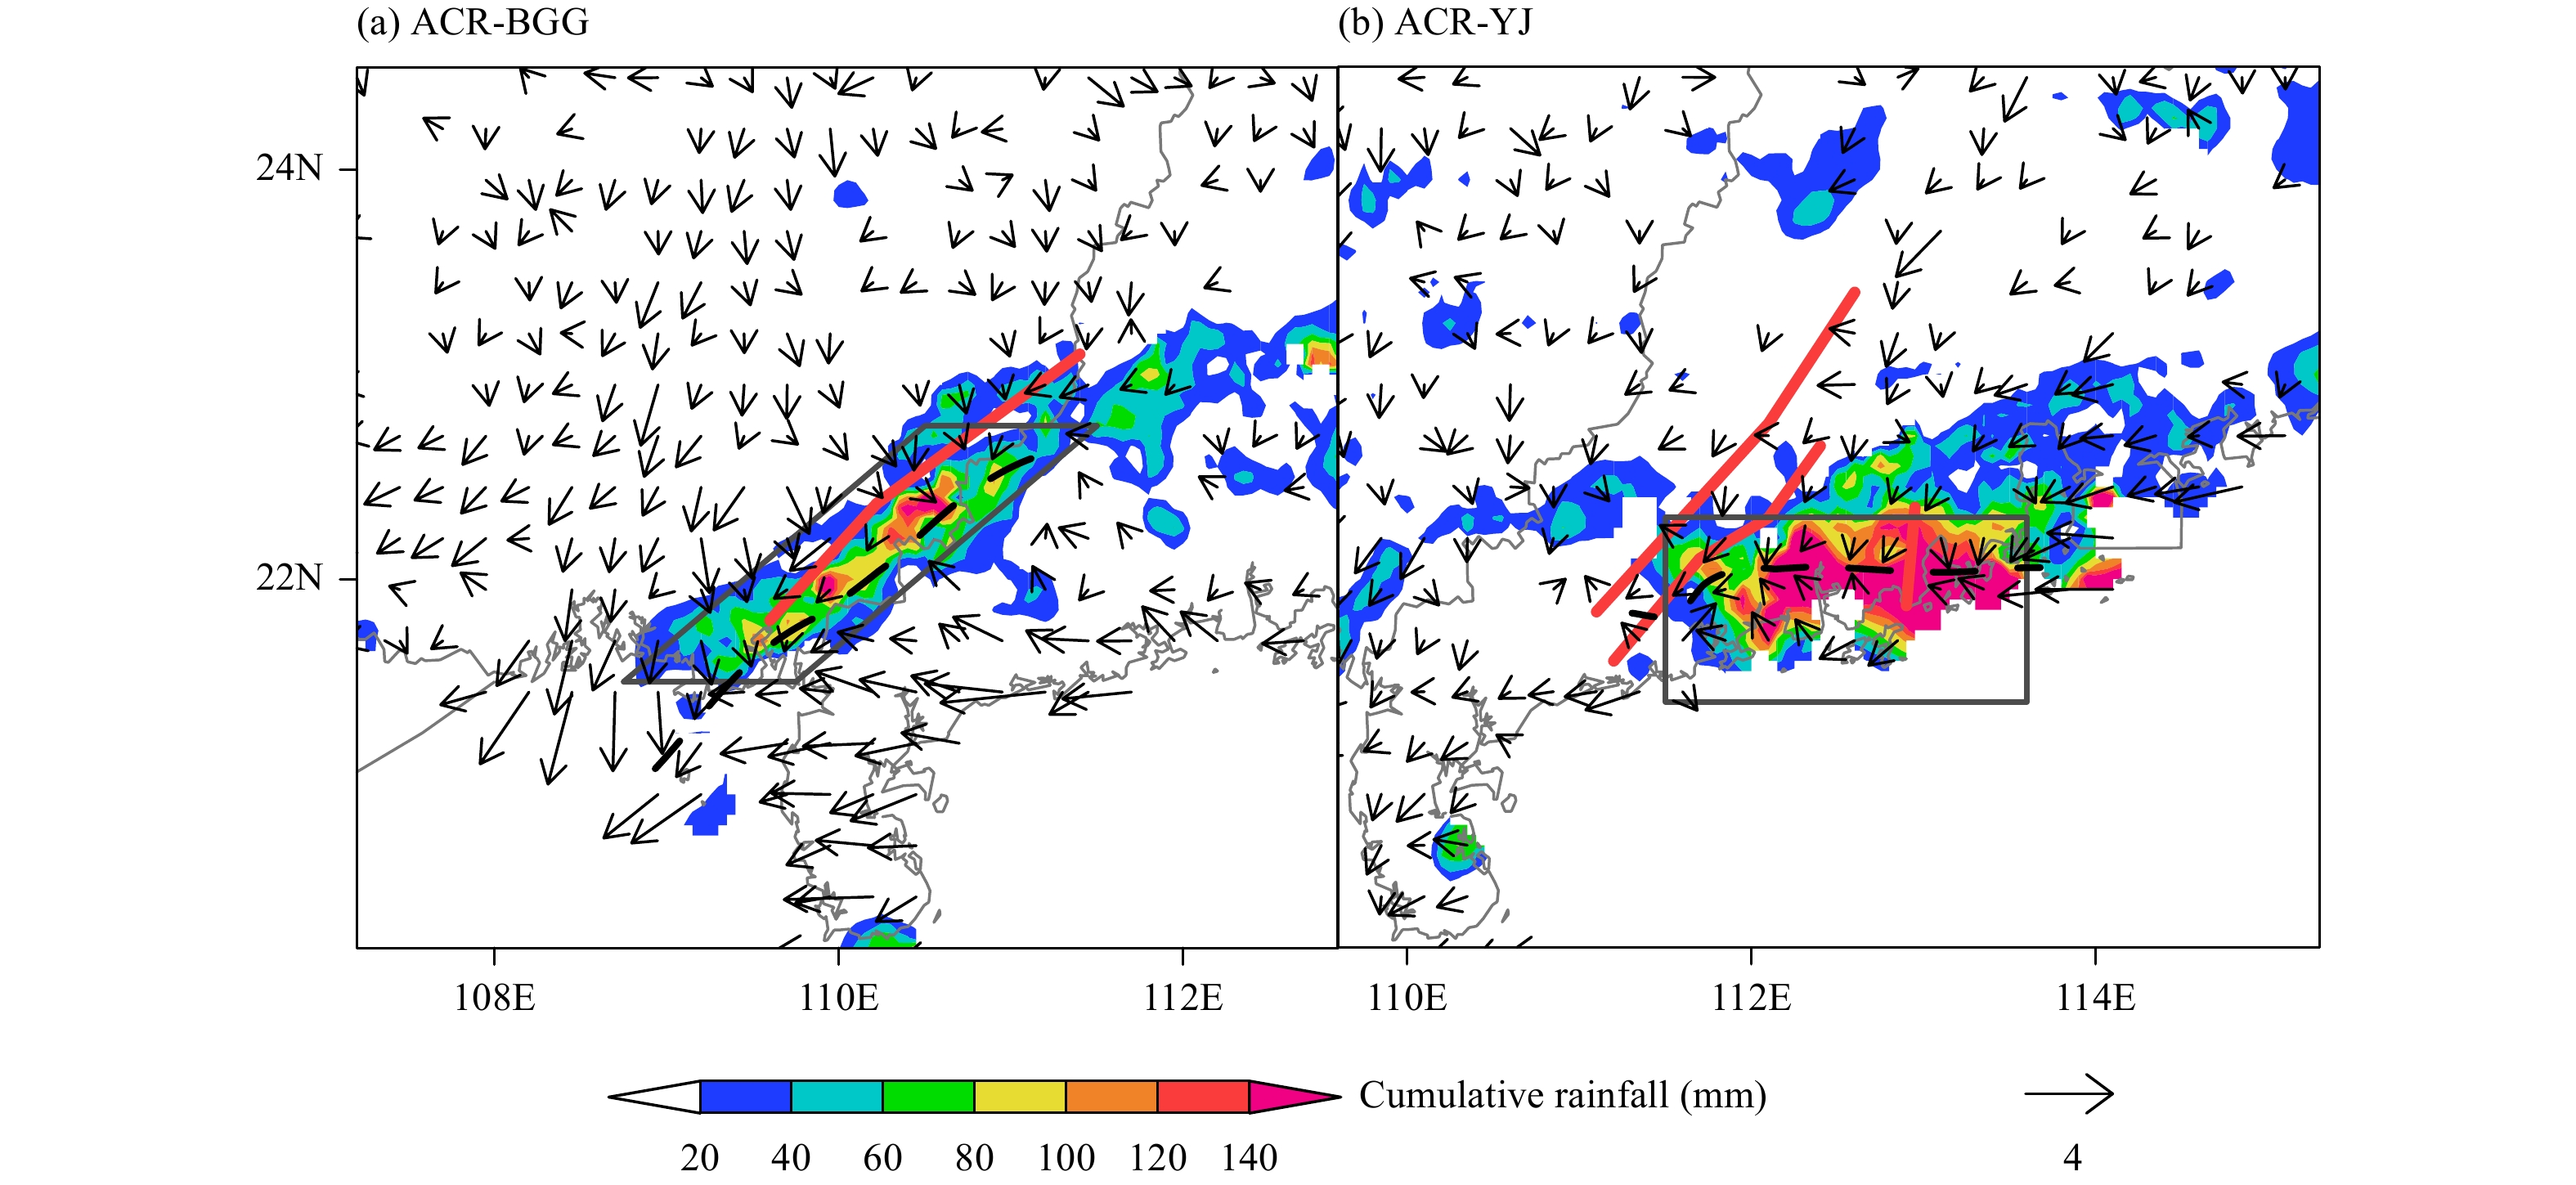
Regarding the orography surrounding BGG and YJ (Fig. 1b), the mountains in these two regions are similarly southwest–northeast oriented. These two regions are close, about 200 km (zonally 2° longitude) apart. However, the OWSR distribution in these two regions in the ACR situation is obviously different (Fig. 2). The accumulated OWSR near BGG is distributed in a south-west–northeast direction along the mountains (Fig. 2a), whereas the accumulated OWSR near YJ extends eastward against the mountains in a west–east direction (Fig. 2b). Furthermore, the average near-surface winds in these two regions also behave notably differently. A clear near-surface convergence line between northerly and southeasterly winds occurs along the mountains near BGG, where the accumulated OWSR is located (Fig. 2a). In comparison, a marked west–east convergence line be-tween northerly and southerly/easterly winds forms and superimposes with the accumulated OWSR near YJ (Fig. 2b). Given these findings, two questions naturally arise: (1) what key factors associated with the ACR situation cause the regional difference in the OWSR distribution, and (2) how do these key factors interact with the orography and affect the OWSR formation? To answer these questions, the features of the ACR situation for the OWSR events in these two regions are compared and analyzed below.
Fig
2.
Distributions of accumulated rainfall (color shading; mm) and averaged wind vector (m s−1) near the surface for the OWSR events near (a) BGG and (b) YJ in the ACR situation. (a) and (b) are based on seven and eight OWSR events, respectively. The red lines indicate the mountain ranges depicted in Fig. 1b, and the dashed black lines indicate convergence lines. The parallelogram and rectangle in (a) and (b) indicate the average areas for the vertical profiles of wind vector and zonal wind speed shown in Figs. 11a, b, respectively.
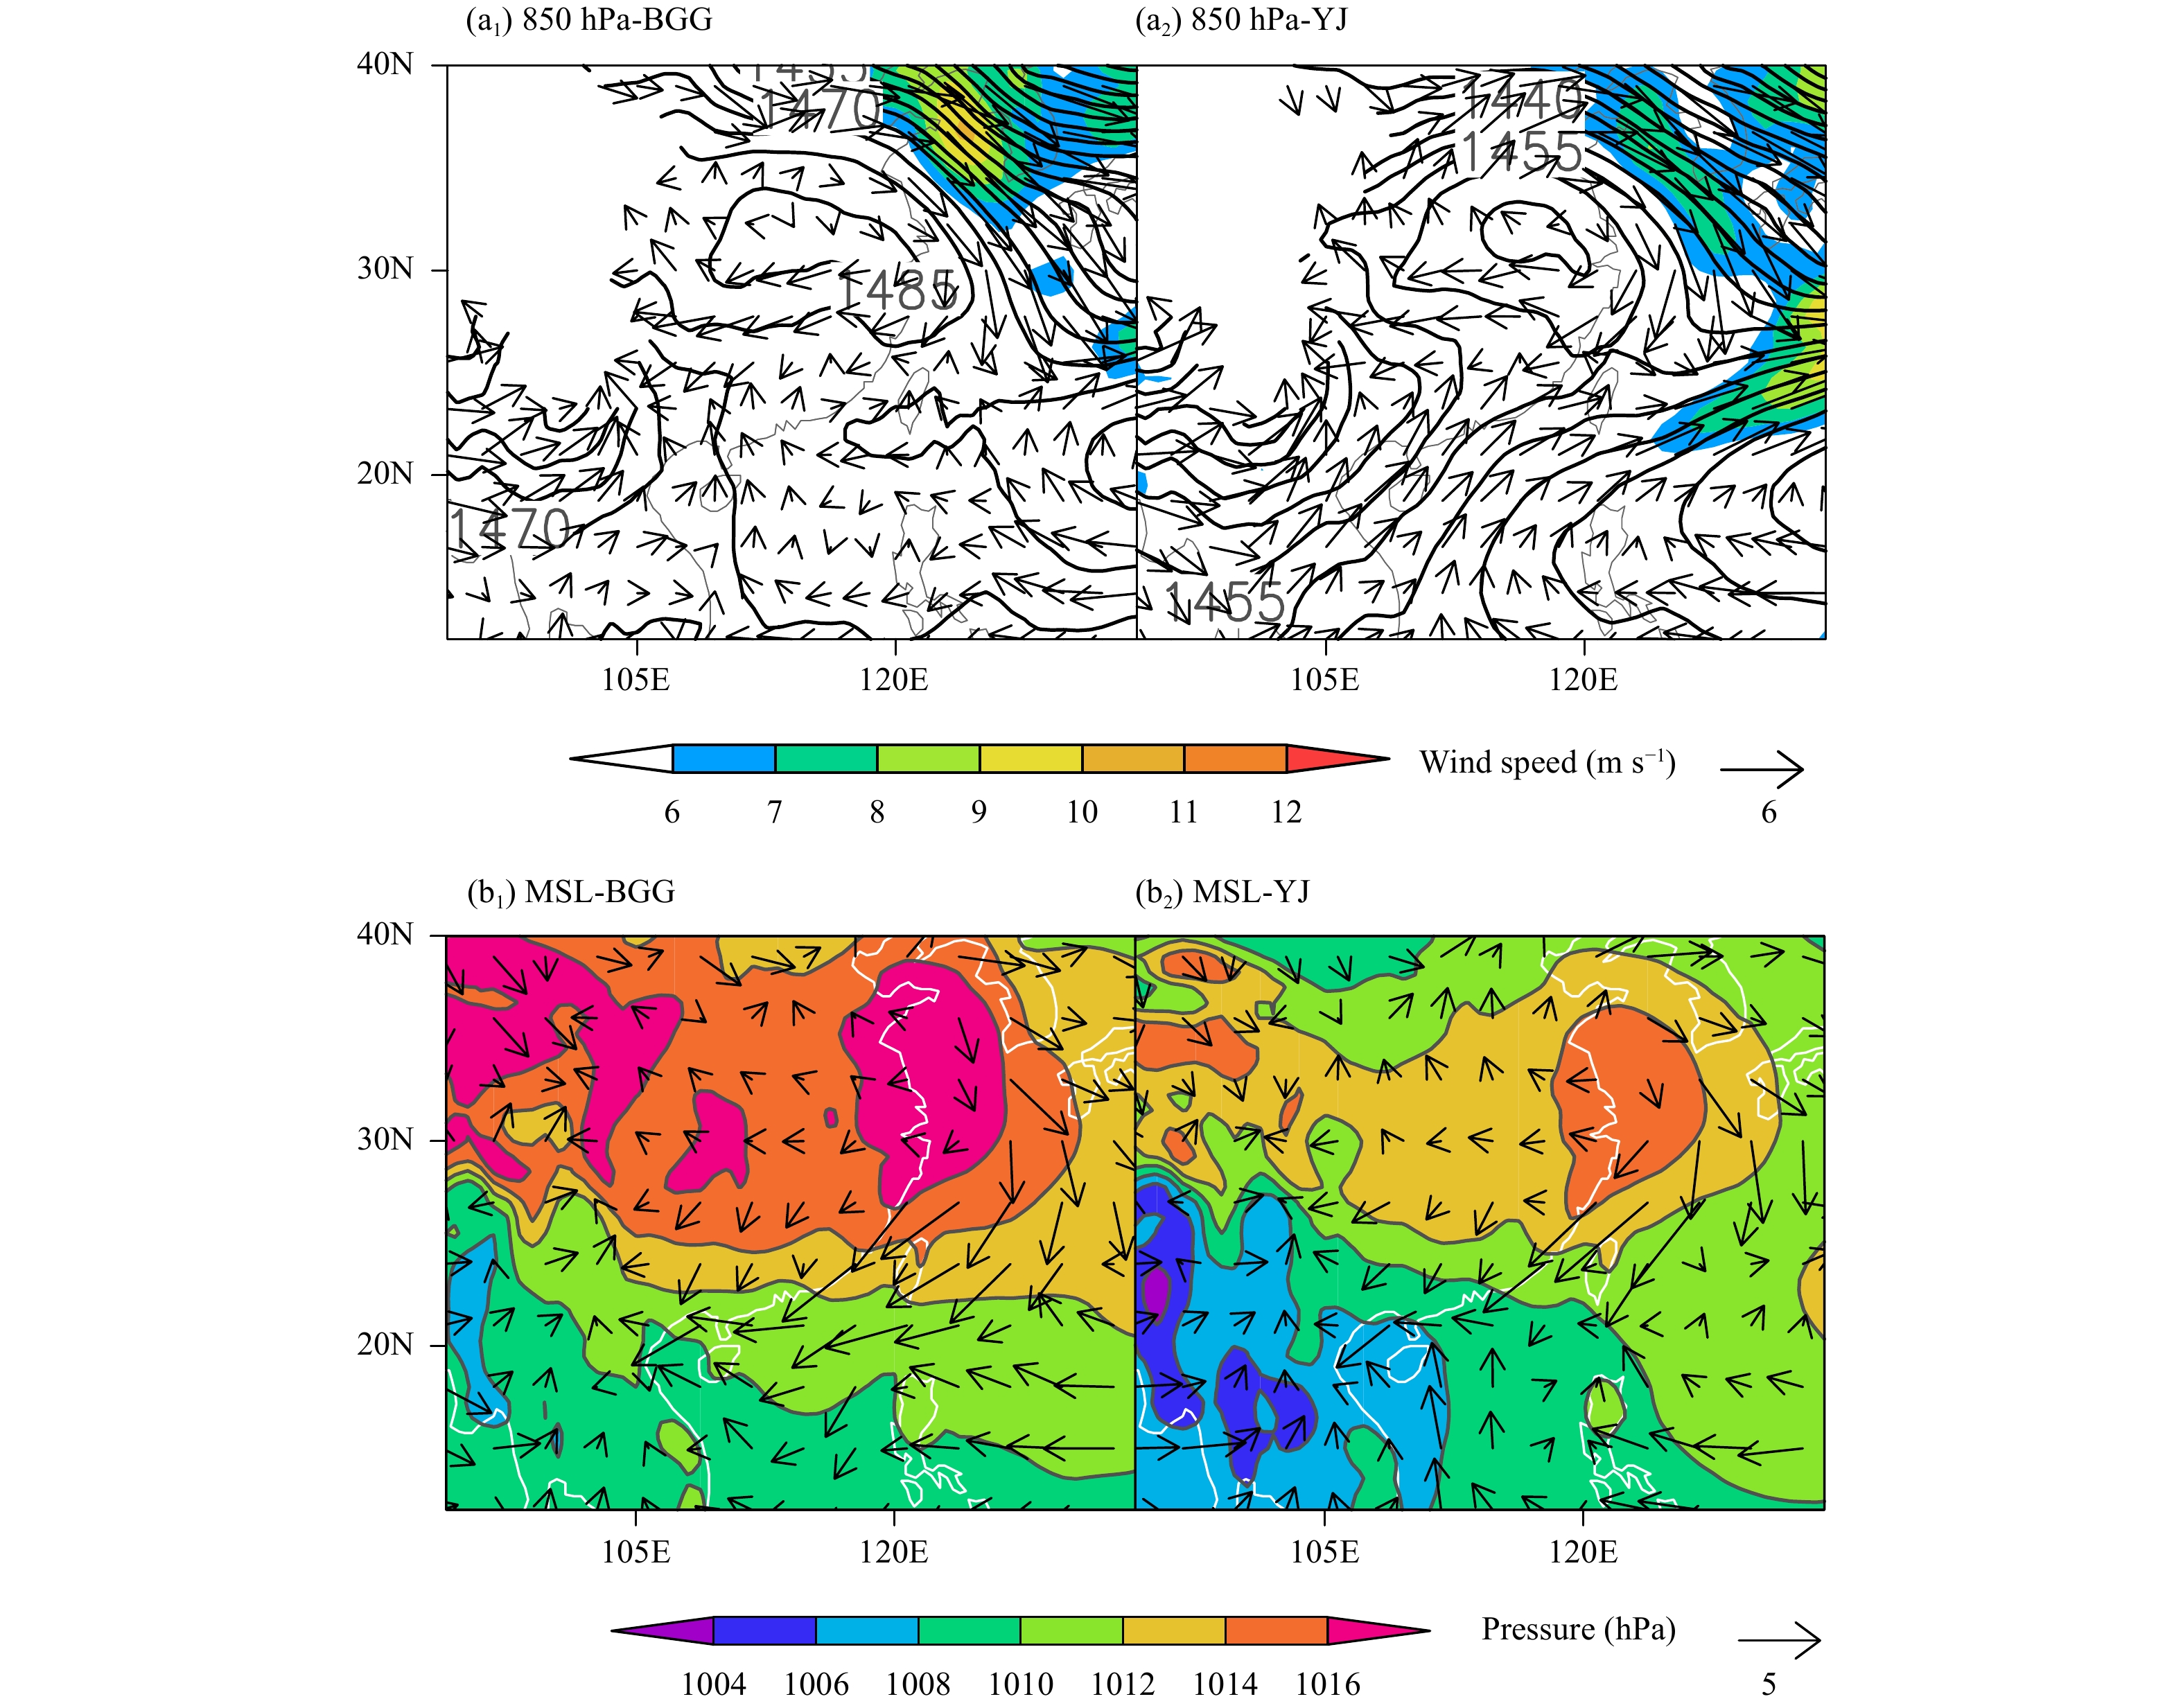
Figure 3 depicts the average 850-hPa and mean-sea-level circulations for the OWSR events near BGG and YJ in the ACR situation. The ACR situation is characterized by a marked anticyclone over the Yangtze River basin and a weak trough over southwestern China (southwest trough). However, the characteristics of these synoptic systems for the OWSR events in the two regions are somewhat different. The anticyclone is stronger and larger when OWSR occurs near BGG, while the southwest trough is stronger when OWSR occurs near YJ (Figs. 3a1, a2). These differences lead to a stronger mean-sea-level high over central China and more intense easterly winds near the coast of South China for the OWSR events occurring near BGG, but a stronger mean-sea-level low over southwestern China and marked southerly winds near the coast of western Guangdong for the OWSR events occurring near YJ (Figs. 3b1, b2). The easterly or southerly winds near the coast converge with the northerly winds associated with the inland mean-sea-level high, providing a favorable lifting condition for the initiation of coastal OWSR.
Fig
3.
The average (a1, a2) 850-hPa and (b1, b2) mean-sea-level circulations for the OWSR events near (a1, b1) BGG and (a2, b2) YJ in the ACR situation. The contours in (a1) and (a2) indicate geopotential height (gpm), and the color-graded areas and vectors indicate wind speed (a1, a2; m s−1) or pressure (b1, b2; hPa) and wind vector (m s−1), respectively.
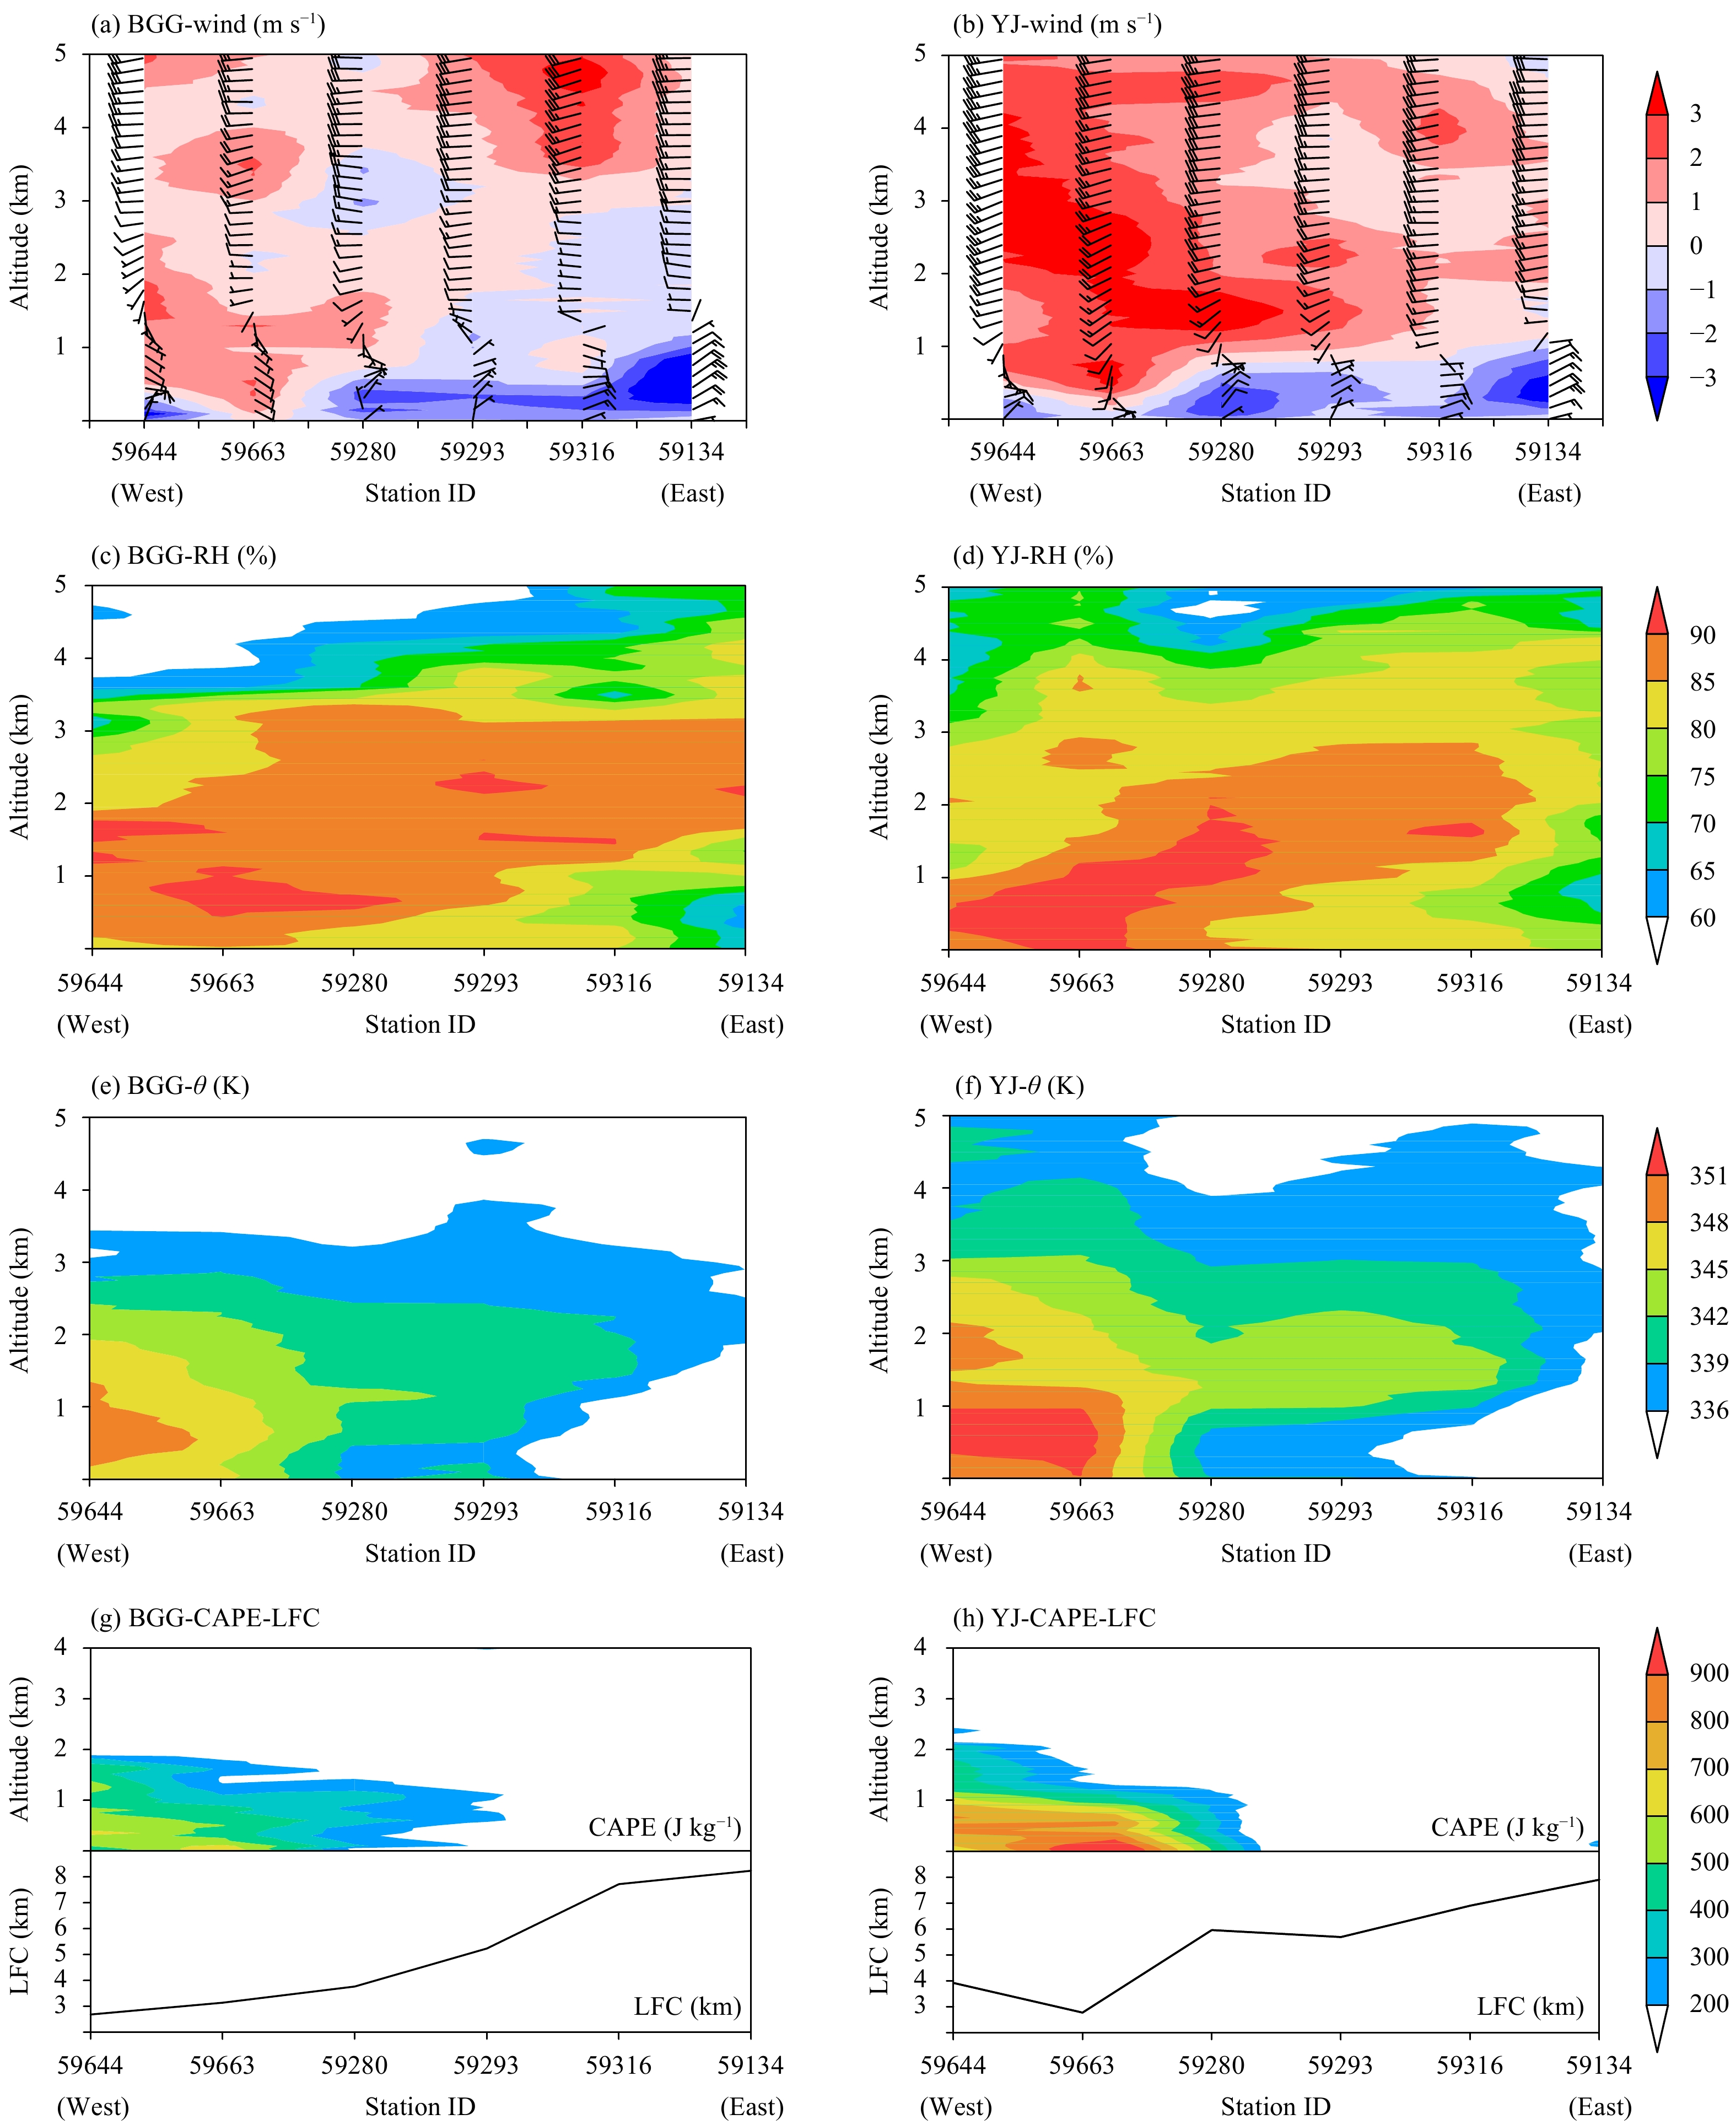
The environmental conditions averaged by the OWSR events occurring near BGG and YJ are shown in Fig. 4. In the ACR situation, substantial northeasterly boundary-layer winds penetrate from the coast of eastern Guangdong (represented by sounding stations 59316 and 59134) to the coast of western Guangdong (represented by sounding station 59663) (see the blue shaded areas in Figs. 4a, b). However, the northeasterly boundary-layer winds gradually turn to easterly boundary-layer winds near the coasts of western Guangdong and Guangxi (represented by sounding station 59644; see the easterly boundary-layer winds at sounding stations 59644 and 59663 in Fig. 4a). Relative to Fig. 3b, this change in the direction of boundary-layer winds is related to the Coriolis force effect to a certain extent. In addition, marked southerly boundary-layer winds replace the easterly boundary-layer winds near the coasts of western Guangdong and Guangxi (see the southerly boundary-layer winds at sounding station 59663 in Fig. 4b) when the mean-sea-level low over southwestern China becomes stronger. As the southerly or easterly boundary-layer winds bring warm and moist air from the sea, the coasts of western Guangdong and Guangxi is influenced by high humidity (Figs. 4c, d), unstable atmospheric stratification (Figs. 4e, f), substantial CAPE, and relatively low LFC (Figs. 4g, h), which are very conducive to the formation of OWSR. In contrast, the northeasterly boundary-layer winds near the coast of eastern Guangdong greatly inhibit the occurrence of favorable environmental conditions for the formation of OWSR (Figs. 4c–h). These findings explain well why the OWSR in the ACR situation primarily occurs near the coasts of western Guangdong and Guangxi, rather than the coast of eastern Guangdong. In addition, the humidity, atmospheric stratification, and instability energy conditions near BGG and YJ are not notably different, although the CAPE near YJ is higher than that near BGG, suggesting that these environmental conditions are not the major cause of the dif-ference in the OWSR distribution between these two regions.
Fig
4.
Vertical sections of (a, b) wind vector (m s−1) and meridional wind speed (color shading; m s−1), (c, d) relative humidity (color shading; %), (e, f) pseudo-equivalent potential temperature (θ; color shading; K), and (g, h) convective available potential energy (CAPE; color shading; J kg−1) and free convection level (LFC; contour; km) averaged for the OWSR events near (a, c, e, g) BGG and (b, d, f, h) YJ.
The above analysis indicates that the boundary-layer winds are the key factor in the ACR situation for the occurrence and regional difference of the OWSR near the coast of South China. Given this finding, the next two sections discuss the effects of the boundary-layer winds on the trigger and propagation processes of OWSR systems near BGG and YJ.
4.
Effects of the key factor on the trigger processes of OWSR systems
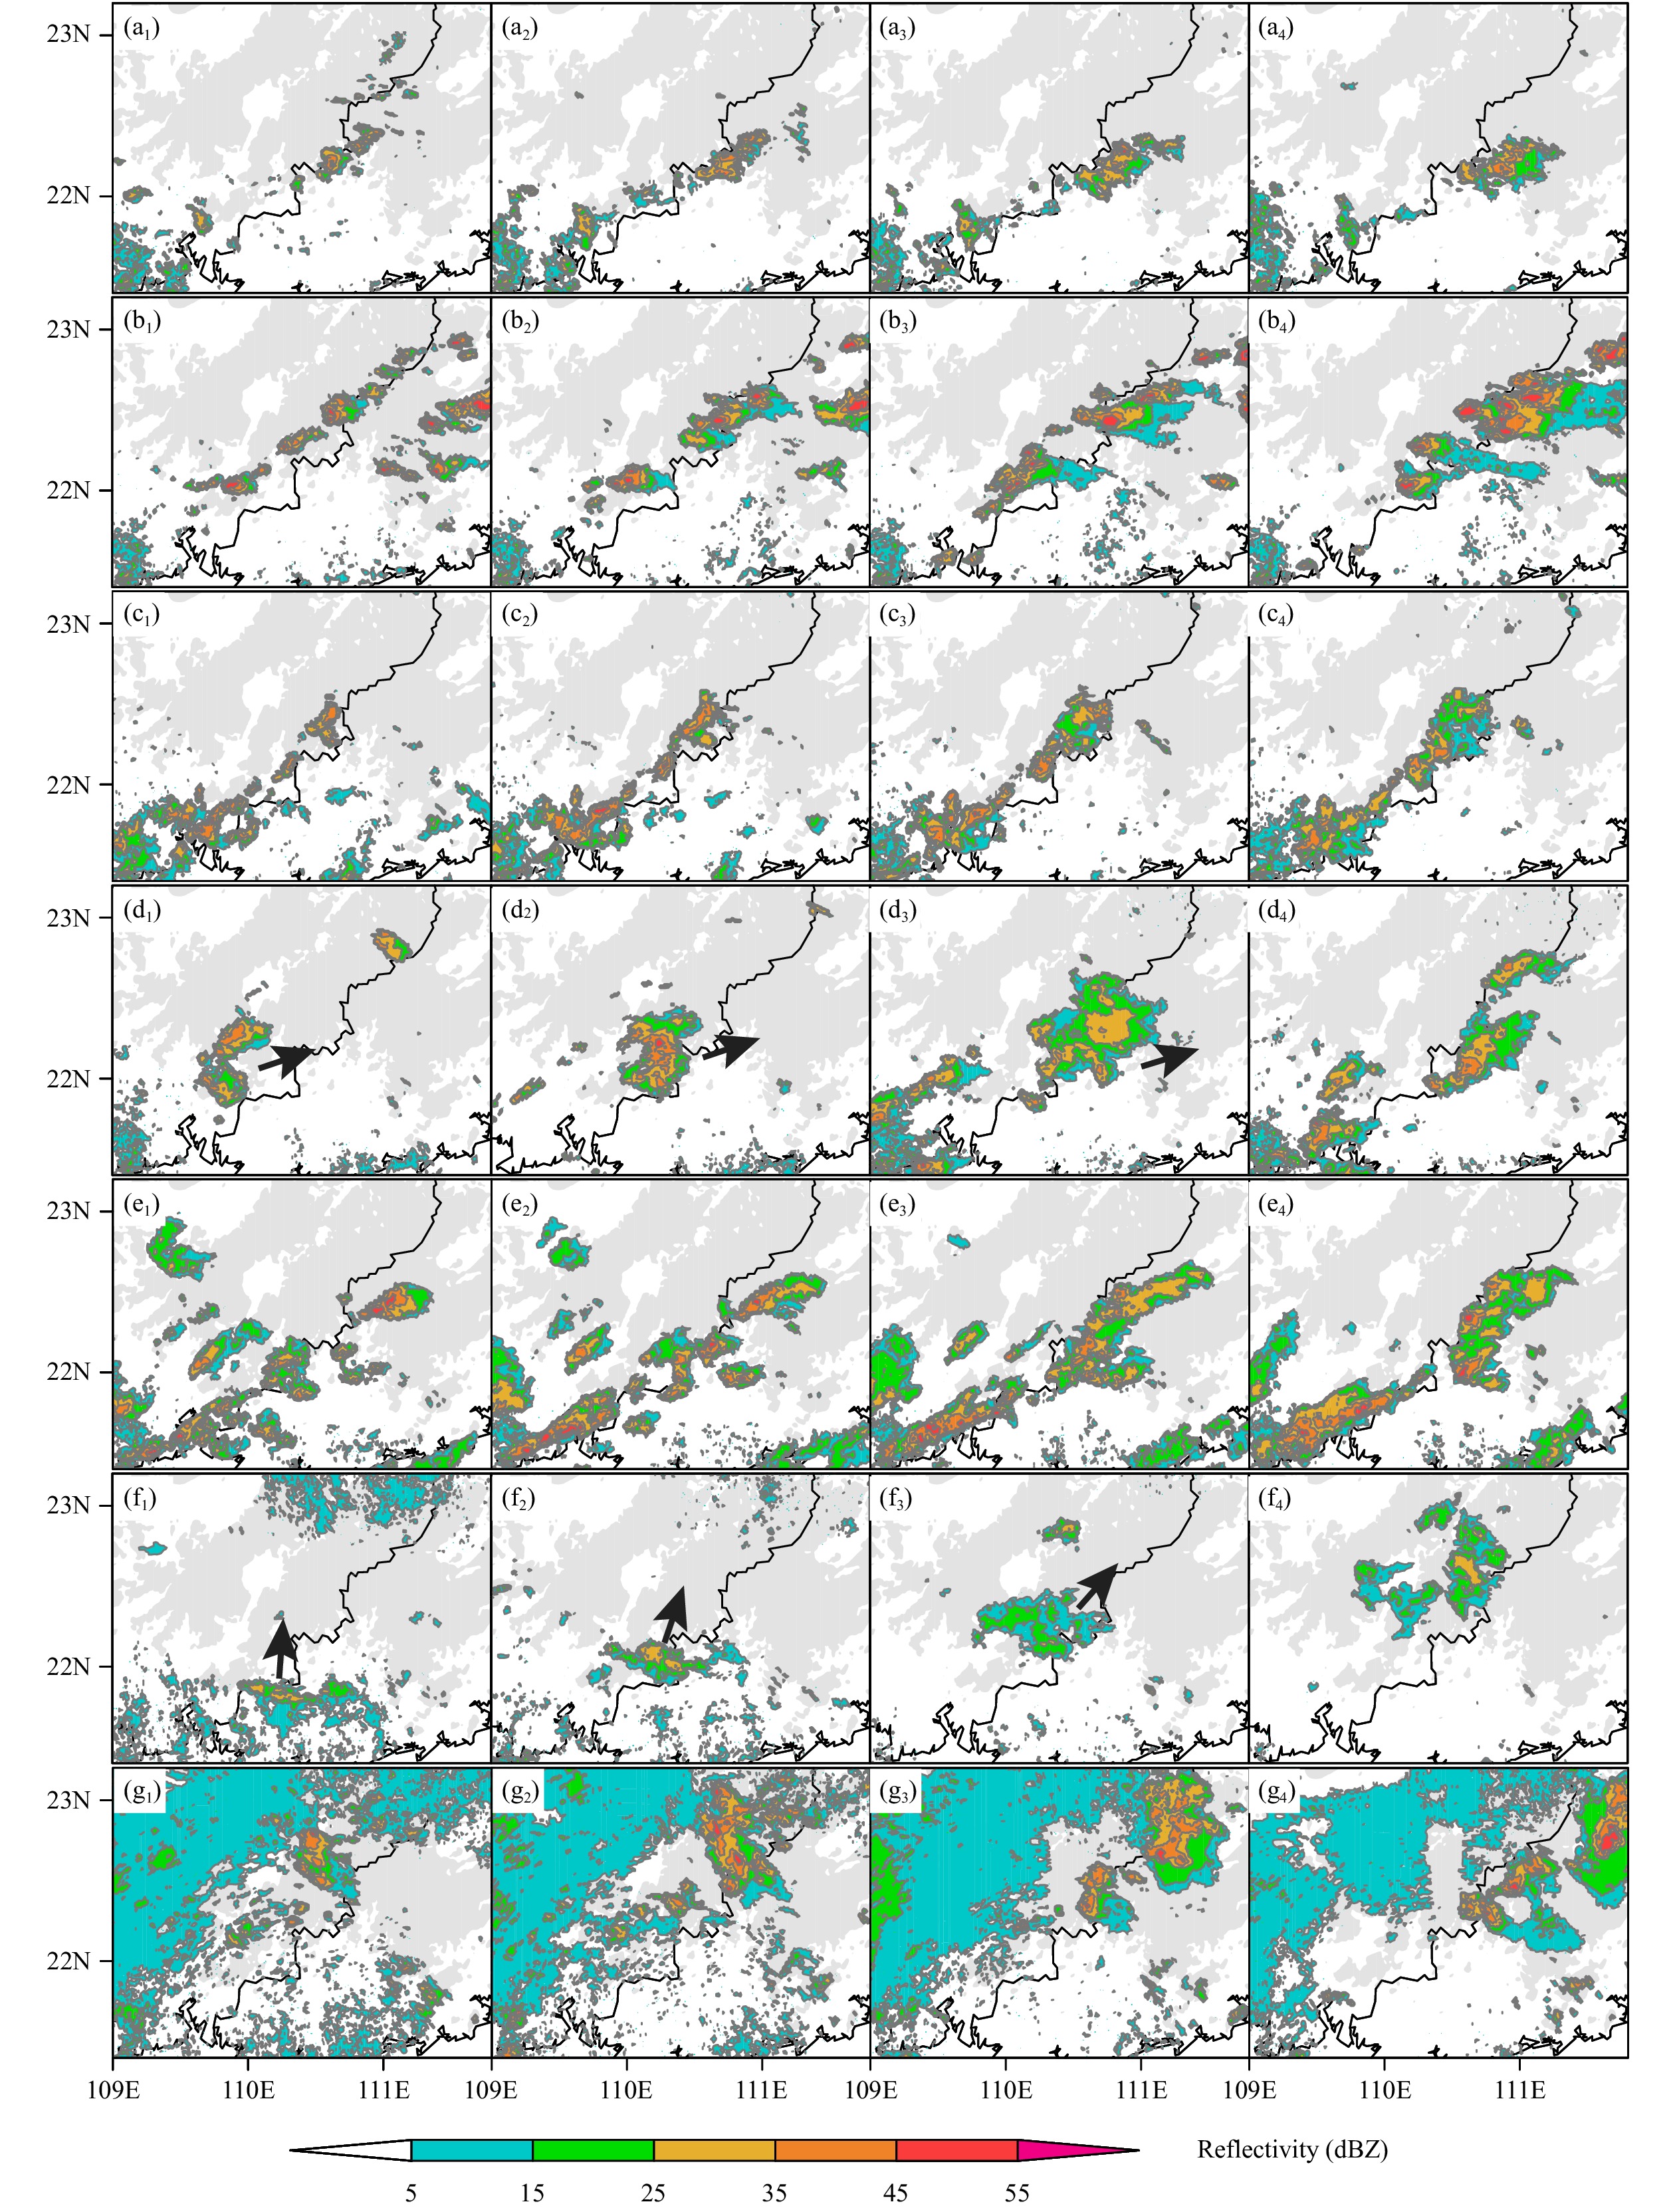
Before discussing the effects of the boundary-layer winds on the trigger and propagation of OWSR systems, the evolution characteristics of convective systems for the OWSR events near the coast of BGG and YJ, which are depicted in Figs. 5, 6, are analyzed first. For most of the OWSR events (five events) near BGG, convective systems initiate and expand along the east side of the mountains, where a convective line eventually forms in a southwest–northeast orientation (Figs. 5a–c, e, g). The convective systems in the other two OWSR events initiate near the coast and then move northeastward across the mountains, and the morphology of the convective systems changes with the mountains.
Fig
5.
Evolution of combined radar reflectivity mosaic (color shading; dBZ) for the OWSR events near BGG in the ACR situation. (a1–a4) 1600–1730 BT 6 April 2012, (b1–b4) 1400–1530 BT 16 April 2012, (c1–c4) 1630–1800 BT 1 June 2012, (d1–d4) 0630–1100 BT 1 May 2014, (e1–e4) 1500–1630 BT 2 May 2014, (f1–f4) 0130–0730 BT 24 April 2015, and (g1–g4) 0030–0500 BT 5 May 2015. The gray-shaded areas indicate the orography higher than 100 m. The arrows indicate the approximate motion directions of the convective systems.
Fig
6.
As in Fig. 5, but for YJ. (a1–a4) 1700–2000 BT 3 May 2011, (b1–b4) 0330–0800 BT 14 May 2011, (c1–c4) 2330 BT 16 April–0230 BT 17 April 2012, (d1–d4) 1800–2230 BT 9 April 2013, (e1–e4) 1330–1630 BT 2 May 2013, (f1–f4) 1500–1800 BT 11 May 2013, (g1–g4) 1300–1600 BT 24 May 2015, and (h1–h4) 1200–1330 BT 11 April 2016.
In contrast, the convective systems in most of the OWSR events near YJ initiate near the coast with a linear distribution oriented west–east (Figs. 6a, b, e–h) or northwest–southeast (Fig. 6d), and principally move eastward (Figs. 6a, c, f, g), expand afterwards (Figs. 6b, d, e) or stagnate (Fig. 6h) along the coast. This contrast indicates that the evolution of the OWSR systems near BGG has a much closer relationship with the mountains than that near YJ, which is consistent with the accumulated OWSR distribution difference between these two regions (Fig. 2).
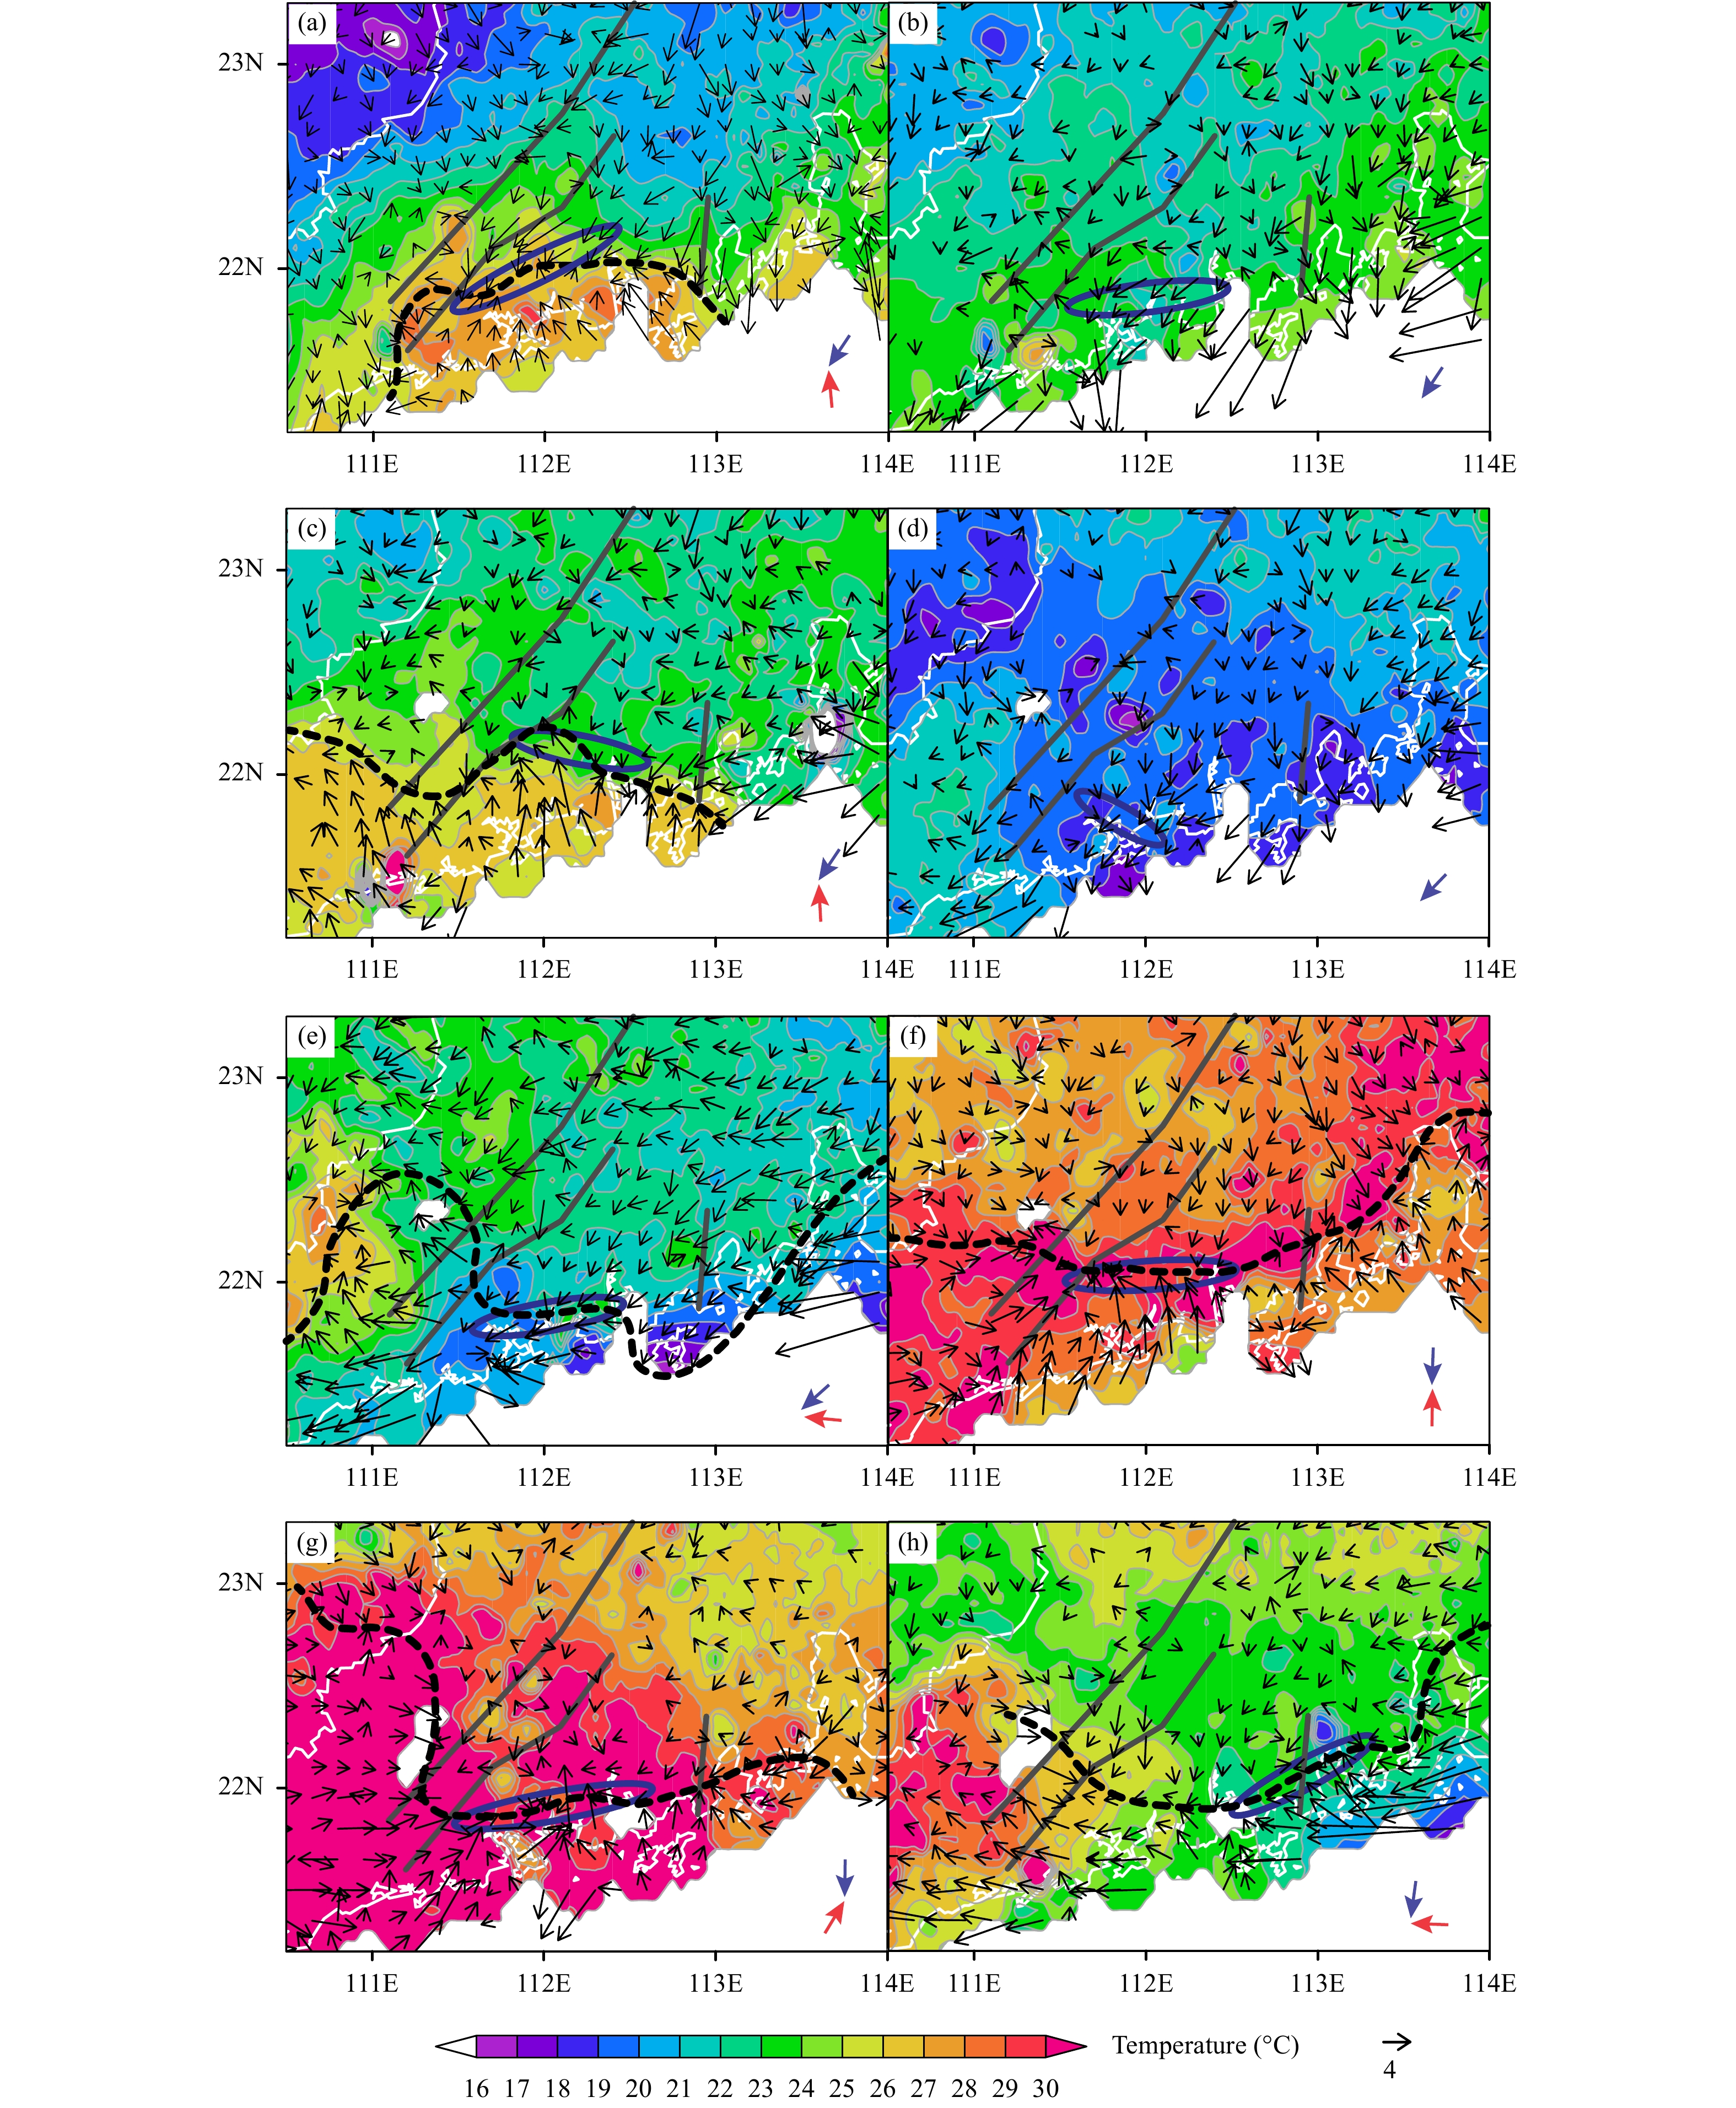
To explain the trigger processes of the OWSR systems, the distributions of near-surface wind vector and temperature before the initiation of convective systems are shown in Figs. 7, 8, along with the locations of convective systems, which are taken from the combined radar reflectivity mosaics shown in Figs. 5, 6. For the OWSR events near BGG, obvious convergence lines between southeasterly/easterly and northerly winds (the dashed lines in Figs. 7a–c, e–g) are shown near the surface almost for all events (six events), and the OWSR systems (the ellipses in Fig. 7) initiate near the convergence lines. This suggests that the convergence lines are probably the key factor for the initiation of the OWSR systems. In addition, most of the convergence lines (five events) occur along the mountains, as intense southeasterly winds converge on the east side of the mountains (Figs. 7a–c, e, g). Examination of the diurnal variations of the average surface wind for the OWSR events near BGG (figure omitted) reveals that the southeasterly winds occur in the afternoon when a strong thermal difference between the mountains and the plain forms (see the warm centers near the mountains in Figs. 7a–c, e). Therefore, the southeasterly winds are primarily caused by the local thermal effect on the easterly winds associated with the ACR situation. Another convergence line between the northerly and easterly winds forms near the coast with a west–east orientation at night when the thermal difference between the mountains and the plain turns weak (Fig. 7f). As for the remaining OWSR event near BGG without an obvious convergence line near the surface (Fig. 7d), the OWSR system initiates owing to the convergence between low-level southwesterly and southeasterly winds, which can be seen from distributions of 850-hPa wind and radar radial wind speed in Figs. 9a, b. However, the relatively high near-surface temperature (greater than 26°C) on the east side of the mountains in the afternoon (Figs. 7a–c, e) favors the initiation and regeneration of convection. In contrast, the relatively colder temperature (less than 23°C) at night inhibits the recurrence of convection near the convergence line between the northerly and easterly winds after their initiation (Figs. 7d, f). This is demonstrated by the evolution of the convective systems in these two events (Figs. 5d, f).
Fig
7.
Distributions of near-surface temperature (color shading; °C) and wind vector (m s−1; larger than 0.5 m s−1) before initiation of the OWSR systems near BGG in the ACR situation. (a) 1500 BT 6 April 2012, (b) 1400 BT 16 April 2012, (c) 1600 BT 1 June 2012, (d) 0400 BT 1 May 2014, (e) 1400 BT 2 May 2014, (f) 0000 BT 24 April 2015, and (g) 0200 BT 5 May 2015. The dashed lines indicate convergence lines, near which the near-surface wind directions are indicated with blue and red arrows. The ellipses indicate the trigger sites of the OWSR systems.
Fig
8.
Distributions of near-surface temperature (color shading; °C) and wind vector (m s−1; larger than 0.5 m s−1) before initiation of the OWSR systems near YJ in the ACR situation. (a) 1900 BT 3 May 2011, (b) 0400 BT 14 May 2011, (c) 0300 BT 17 April 2012, (d) 1800 BT 9 April 2013, (e) 1400 BT 2 May 2013, (f) 1400 BT 11 May 2013, (g) 1300 BT 24 May 2015, and (h) 1200 BT 11 April 2016. The solid gray lines indicate the mountain ranges, and the dashed lines indicate convergence lines, near which the near-surface wind directions are indicated with blue and red arrows. The ellipses indicate the trigger sites of the OWSR systems.
Fig
9.
Distributions of (a, c, f) low-level circulation (contour: geopotential height, gpm; vector: wind, m s−1) at (a) 850 and (c, f) 1000 hPa; (b, d, g) radar radial wind speed (color shading; m s−1); and (e, h) radar reflectivity (color shading; dBZ) during the initiation of the OWSR systems shown in (a, b) Fig. 7d, (c–e) Fig. 8b, and (f–h) Fig. 8d. (a, b) 0200 and 0814 BT 1 May 2014; (c–e) 0200, 0000, and 0000 BT 14 May 2011; and (f–h) 2000, 1800, and 1800 BT 9 April 2013. The red lines and the green rectangles in (a, c, f) indicate the locations of low-level convergence lines and radar stations, respectively. The white/black and blue vectors in (b, d, g) indicate the low-level wind directions and the approximate motion directions of convective systems, respectively. The red lines in (b, d, e, g, h) indicate the locations of convective systems.
Regarding the OWSR events near YJ, obvious convergence lines (the dashed lines in Fig. 8) also occur and promote the initiation of OWSR systems (the ellipses in Fig. 8) for most of the events (Figs. 8a, c, e–h). These convergence lines are produced by the intersection between northerly and southerly/easterly winds, but oriented roughly west–east, which is different from the convergence lines for the OWSR events near BGG. With respect to the other two OWSR events, no obvious near-surface convergence lines are shown over the land (Figs. 8b, d). Further investigation reveals that the trigger sites of the convective systems in these two events are also accompanied by obvious boundary-layer convergence lines between easterly and northerly winds (Figs. 9c–h) over the sea or near the coastline. In contrast, compared with the northerly or easterly winds, the southerly winds produce higher temperature near the convergence lines (Figs. 8a, c, f, g), providing a more favorable condition for the initiation and recurrence of convection (Figs. 6a, c, f, g).
Unlike most of the convergence lines near BGG, there is no obvious sign that the convergence lines near YJ have a close relationship with the mountains, as they form near the coast at a certain distance from the mountains. To clarify this, the wind vectors near the surface for all OWSR events near YJ, along with northerly wind speeds, are depicted in Fig. 10. In addition, the primary flow paths beside the mountains and the locations of the convergence lines are marked with arrows and dashed lines in Fig. 10, respectively. It can be seen that the southwest–northeast distributed mountains near YJ (the rectangle in Fig. 10a) divert the near-surface northerly winds, generating two marked northeasterly air currents on the east side of the mountains and in the valley, respectively. Furthermore, relatively strong northerly wind speeds occur along with these two air currents. The enhancement of the air current is probably caused by the narrow pipe effect related to the wind confluence in the valley or on the windward side of the mountains. The two strong northeasterly air currents strengthen their convergence with the southerly or easterly winds near the coast of YJ, where the OWSR systems tend to first initiate as a result.
Fig
10.
Distributions of wind vector (larger than 0.5 m s−1; m s−1) and northerly wind speed (contour; m s−1) near the surface during initiation of the OWSR systems near YJ in the ACR situation. (a) 1900 BT 3 May 2011, (b) 0400 BT 14 May 2011, (c) 0300 BT 17 April 2012, (d) 1800 BT 9 April 2013, (e) 1400 BT 2 May 2013, (f) 1400 BT 11 May 2013, (g) 1300 BT 24 May 2015, and (h) 1200 BT 11 April 2016. The blue-shaded areas indicate the orography higher than 100 m, and the rectangle in (a) indicates the location of YJ. The dashed lines indicate convergence lines, and the arrows indicate the approximate flow paths beside the mountains near YJ.
5.
Effects of the key factor on the propagation processes of OWSR systems
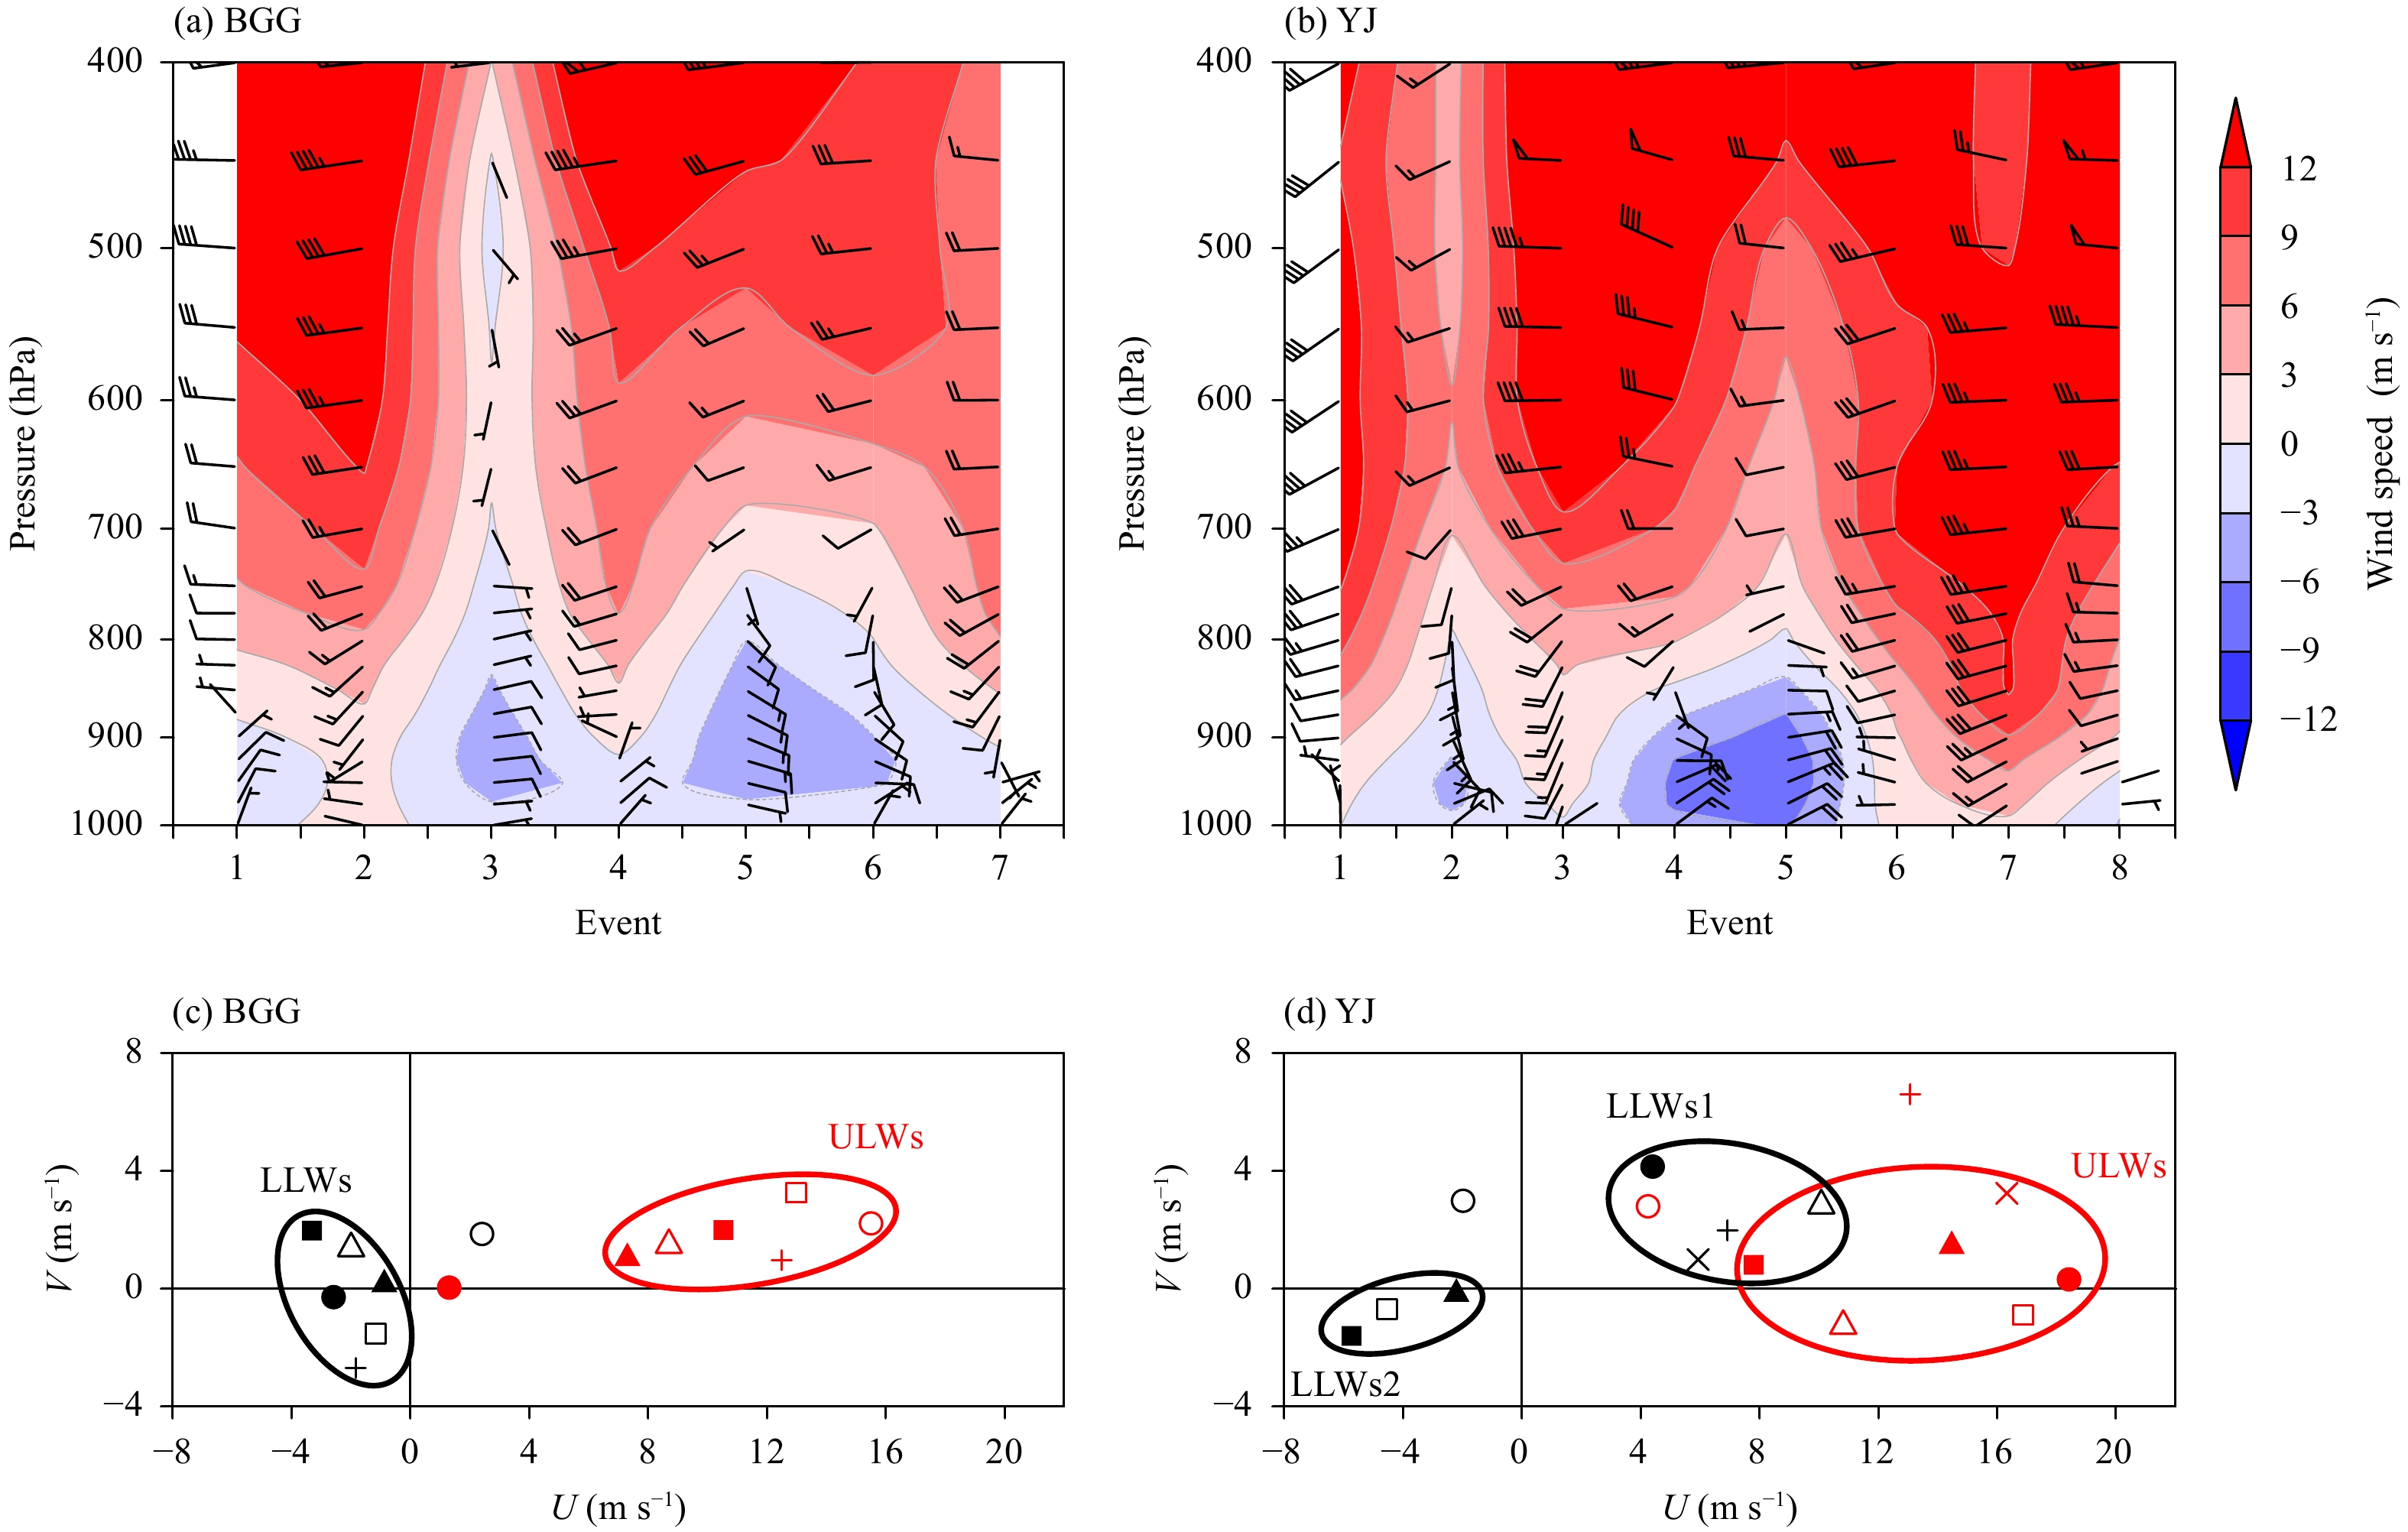
With respect to the effects of the boundary-layer winds on the propagation processes of OWSR systems, the vertical wind profiles for all OWSR events near BGG are shown in Figs. 11a, b, along with the zonal wind speed profiles. Note that easterly winds dominate in the boundary layer for almost all the events near BGG (Fig. 11a). In contrast, half of the events near YJ are controlled by easterly winds in the boundary layer, while the other half of the events are influenced by southwesterly winds (Fig. 11b). These features of the boundary-layer winds are consistent with those shown from the near-surface winds of the OWSR events in the two regions (Figs. 7, 8). In addition, westerly winds prevail above the easterly or southwesterly winds for both of the events near BGG and YJ.
Fig
11.
(a, b) Vertical profiles of wind vector (m s−1) and zonal wind speed (color shading; m s−1), and (c, d) hodographs of low-level average easterly/southwesterly wind (black marks) and upper-level average westerly wind (red marks) for the OWSR events near (a, c) BGG and (b, d) YJ in the ACR situation. The vertical profiles of wind vector and zonal wind speed near (a) BGG and (b) YJ are averaged over 3 h during the OWSR events and the rectangle areas shown in Figs. 2a, b, respectively. The low-level easterly (southwesterly) winds are defined as the winds below the boundary between easterly and westerly winds (700 hPa), and the upper-level westerly winds are defined as the winds between the boundary (700 hPa) and 300 hPa. The black and red ellipses “LLWs” and “ULWs” in (c) and (d) indicate the approximate wind direction quadrants of the low-level average easterly/southwesterly winds and the upper-level average westerly winds, respectively.
The boundary-layer winds can further influence the evolution of convergence lines and therefore the regene-ration of convective cells, whereas the upper-level winds translate the convective cells downwind after they are regenerated. The combination of these effects ultimately affects the propagation characteristics of convective systems. In view of this, the low-level average southwesterly or easterly winds and the upper-level average westerly winds are calculated and depicted in Figs. 11c, d. The low-level southwesterly winds are defined as the southwesterly winds below 700 hPa, and the upper-level westerly winds are defined as the westerly winds above the low-level southwesterly or easterly winds and below 300 hPa. Easterly boundary-layer winds are clearly shown during the evolution of the convective systems near BGG (see the ellipse “LLWs” in Fig. 11c). The easterly boundary-layer winds help push the convergence lines toward the east side of the mountains. Consequently, the convective cells are apt to recur along or toward the mountains, which is indicated by the maintenance or recurrence of convection on the east side of the mountains (Figs. 5a, c–e, g) or the migration of convection line toward the mountains (Figs. 5f1, f2). In contrast, the upper-level southwesterly winds (see the ellipse “ULWs” in Fig. 11c) in most of the OWSR events near BGG promote convective cells to translate northeastward along the mountains, which is indicated by the stagnation of convection lines beside the mountains (Figs. 5a–c, e, g) or the propagation of convections along the mountains (Figs. 5d, f3, f4).
In regard to the OWSR events near YJ, two types of coupling between boundary-layer winds and upper-level winds are shown (Fig. 11d). One type is characterized by southwesterly boundary-layer winds coupled with westerly upper-level winds (see the winds in the ellipses “LLWs1” and “ULWs” in Fig. 11d). The southwesterly boundary-layer winds are resisted by the northerly boundary-layer winds, leading to the stagnation of the west–east convergence lines, as well as the development of convective cells along these lines. At the same time, the westerly upper-level winds tend to translate the developed convective cells eastward. As a result, the convective lines or systems are prone to move eastward after they form along the convergence lines (Figs. 6a, c, f, g). In contrast, the other type features the coupling of easterly boundary-layer winds with westerly upper-level winds (see the winds in ellipses “LLWs2” and “ULWs” in Fig. 11d). This vertical wind structure also promotes an eastward propagation of the convective cells developing at the convergence lines, but facilitates a westward regeneration of convective cells along the convergence lines, as the advance of the easterly boundary-layer winds favors a westward expansion of the convergence lines between them and the northerly boundary-layer winds. Consequently, the convective lines tend to maintain or expand (Figs. 6b, d, e, h).
6.
Summary and discussion
The warm-sector rainstorms are difficult to forecast, principally owing to the poor skill in accurately forecasting the initiation and organization of warm-sector rainfall systems. Previous case and statistical studies have indicated that the low-level jet is a common influential system for the trigger and organizational processes of warm-sector rainfall systems. A recent statistical analysis (Liang et al., 2019) revealed that, besides the low-level jet synoptic situation, another synoptic situation characterized by a marked low-level anticyclone over the Yangtze River basin (referred to as synoptic situation ACR) is also prone to produce OWSR near the coast of South China. However, the effects of the ACR situation on the formation of warm-sector rainstorms in South China have not been discussed in previous studies. In view of this, the present study analyzes the effects of this situation on the formation of OWSR near the coast of South China. The causes of the regional difference in the coastal OWSR in this situation are also discussed. The major findings are summarized as follows and illustrated schematically in Fig. 12.
Fig
12.
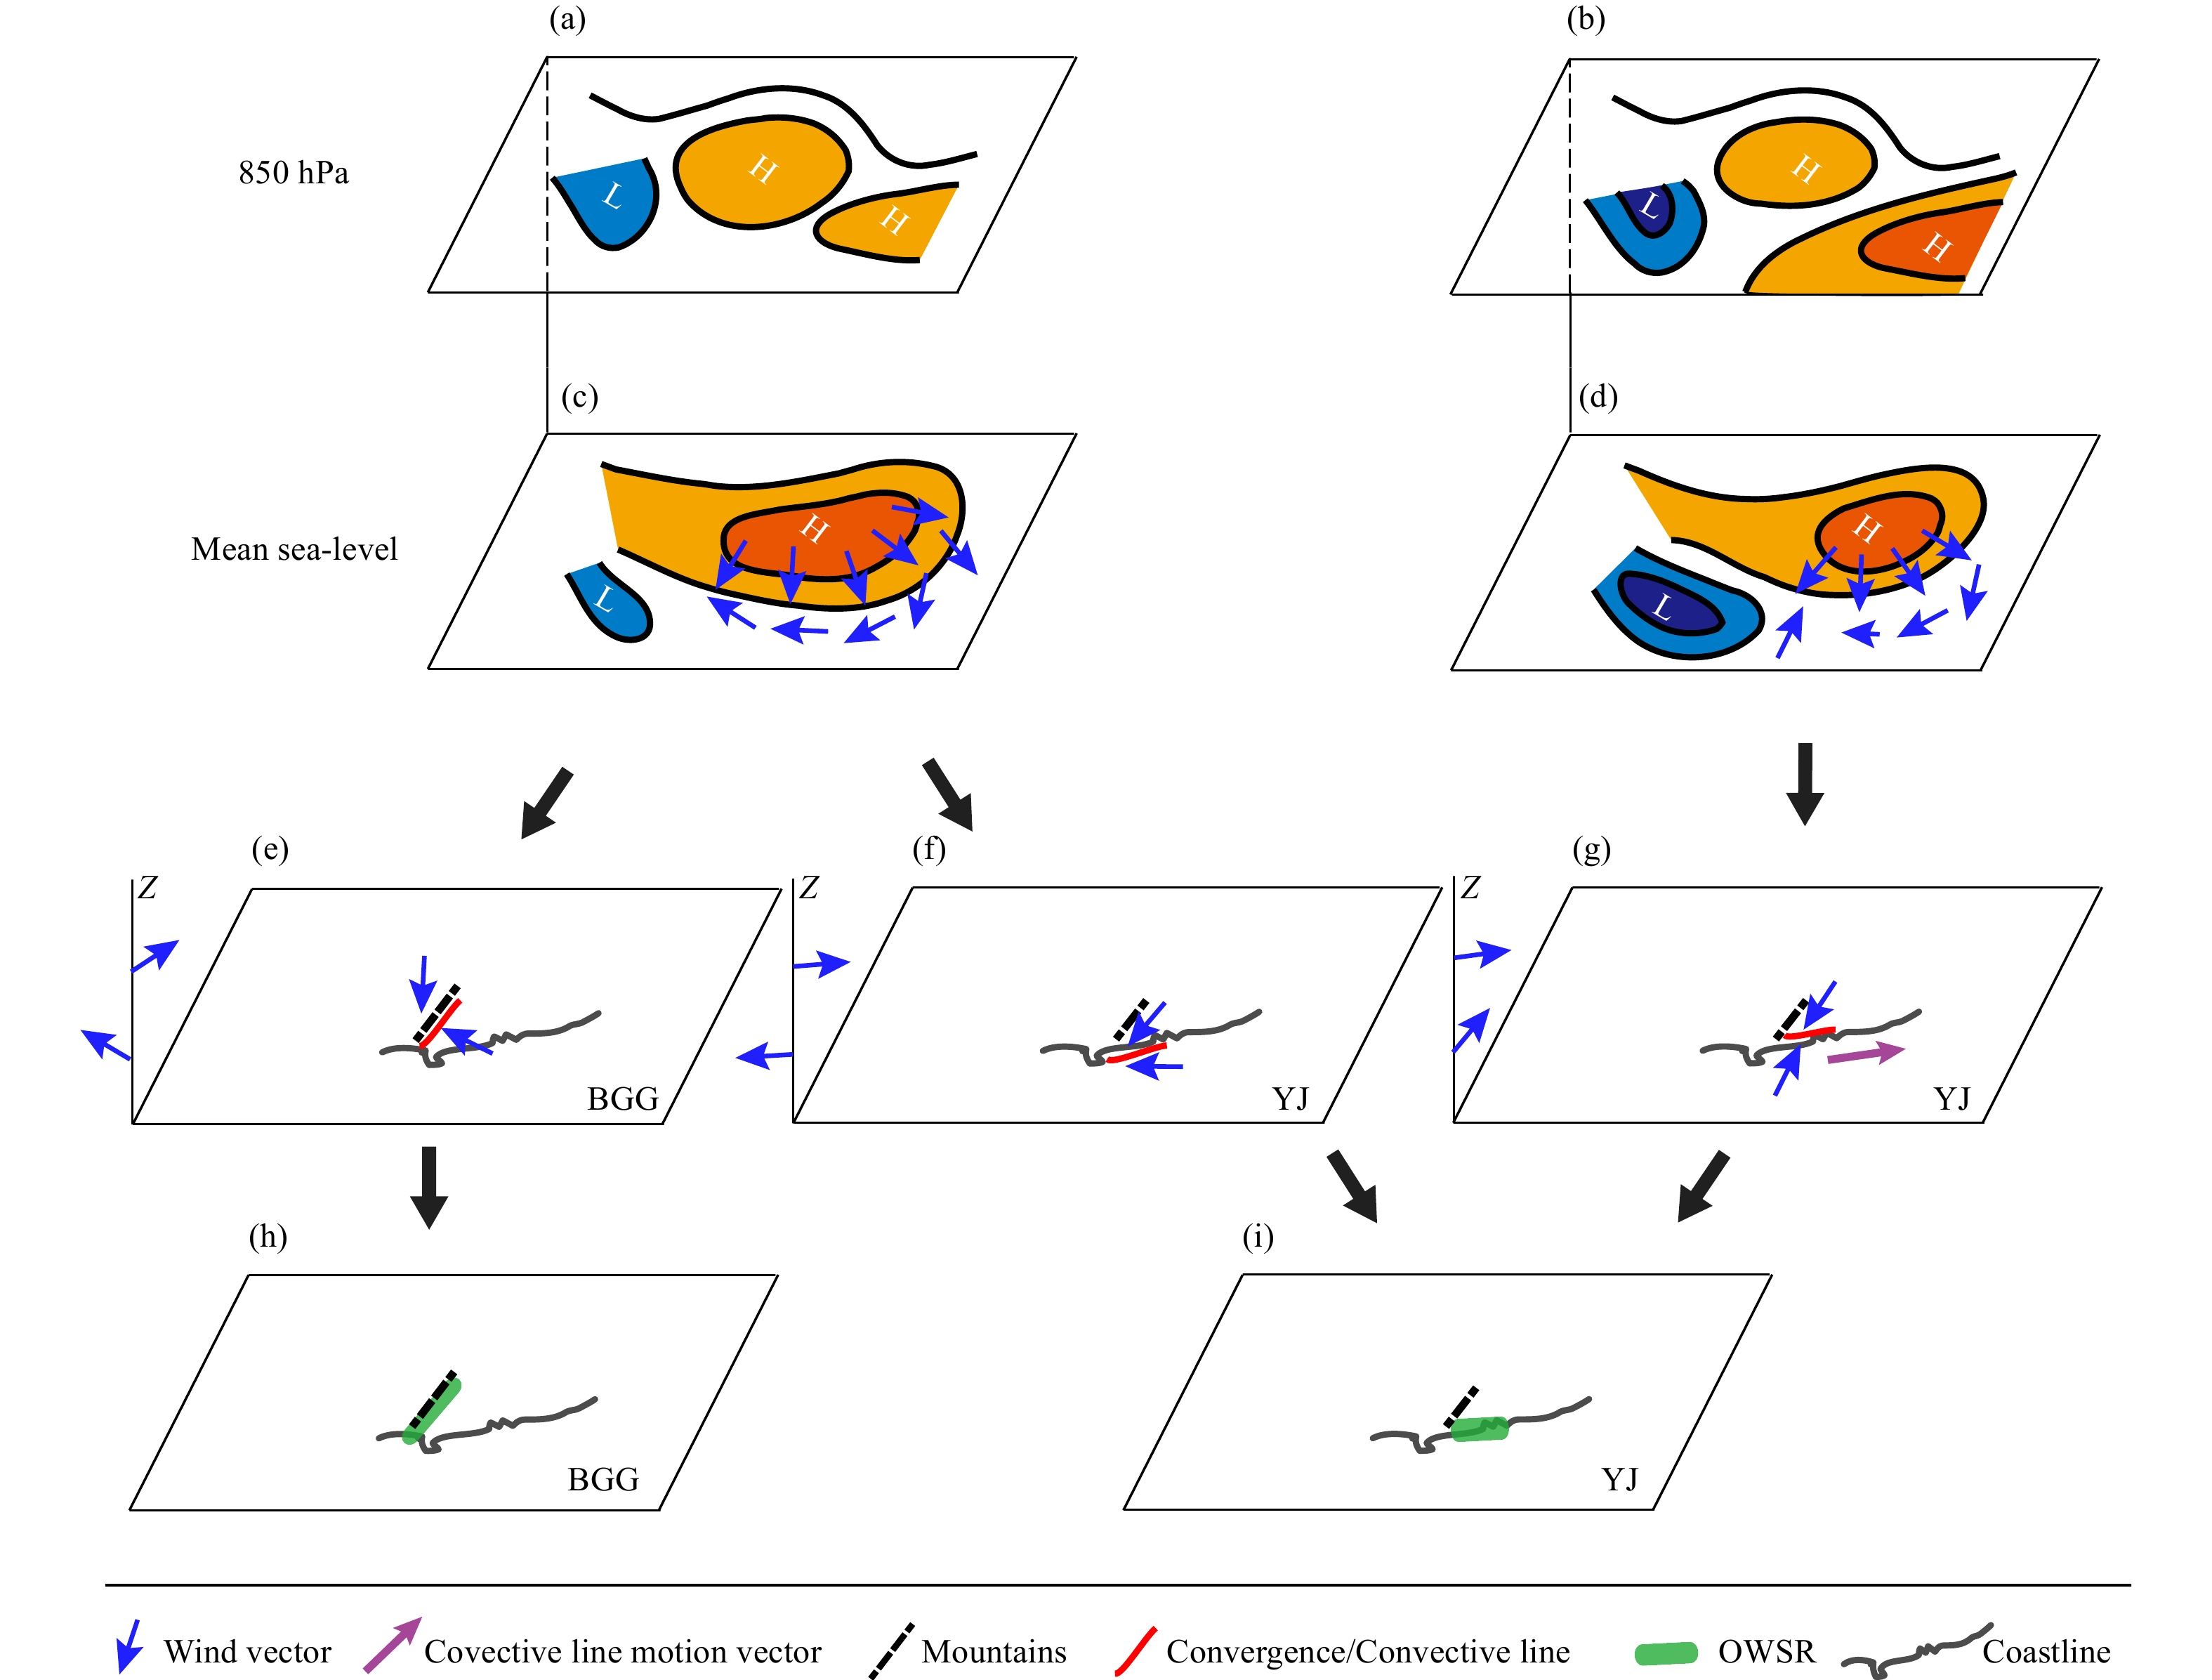
Schematic diagrams of (a–d) the ACR synoptic situation [(a, b) 850 hPa and (c, d) mean sea-level], (e–g) convergence/convective lines and vertical wind profiles, and (h, i) OWSR distribution near (a, c, e, h) BGG and (b, d, f, g, i) YJ.
The low-level anticyclone and associated mean-sea-level high in the ACR situation produce marked northerly boundary-layer winds inland, and cause northeasterly boundary-layer winds near the coast of eastern Guangdong and easterly boundary-layer winds near the coasts of western Guangdong and Guangxi under the Coriolis force effect (Figs. 12a, c). The easterly boundary-layer winds turn to southeasterly boundary-layer winds near the coast of BGG in the afternoon (Fig. 12c) owing to the strong mountain–plain thermal difference, and southerly boundary-layer winds near the coast of western Guangdong when the southwest trough becomes stronger (Figs. 12b, d). Compared with the northeasterly boundary-layer winds, the southeasterly, easterly, or southerly boundary-layer winds produce high humidity, unstable atmospheric stratification, substantial CAPE, and a relatively low LFC. Consequently, OWSR tends to occur near the coasts of western Guangdong and Guangxi, rather than the coast of eastern Guangdong.
The southeasterly boundary-layer winds converge beside the mountains near BGG, producing stable convergence or a convective line along the mountains (see the red line in Fig. 12e). The convective line tends to persist with the help of upper-level southwesterly winds (see the red line and vertical wind profile in Fig. 12e), which facilitates the propagation of convective cells along the convective line. As a result, heavy OWSR occurs along the mountains near BGG (Fig. 12h).
In contrast, the easterly or southwesterly boundary-layer winds keep converging with the northerly boundary-layer winds, producing a stable convergence line oriented west–east near the coast of western Guangdong (see the near-surface wind vectors and red lines in Figs. 12f, g). The confluence effect of the mountains near Yangjiang on the northerly boundary-layer winds enhances the strength of the northerly boundary-layer winds, leading to the strengthening of convergence near Yangjiang. As a result, a convective line tends to initiate first near Yangjiang (see the red lines in Figs. 12f, g). The coupling of upper-level westerly winds with the easterly boundary-layer winds encourages a quasi-stationary or expanding convective line (see the vertical wind profile and red line in Fig. 12f), as the regeneration and propagation directions of the convective cells are opposite. In contrast, the coupling of upper-level westerly winds with the southwesterly boundary-layer winds promotes an in situ or eastward regeneration and an eastward propagation of convective cells, leading to an eastward motion of the convective line (see the vertical wind profile and convective line motion vector in Fig. 12g). Both of the couplings cause west–east-oriented heavy OWSR near the coast of Yangjiang (Fig. 12i).
The convergence lines presented for the OWSR events in the ACR situation in this study are basically quasi-stationary, which may lead to continuous interaction between the outflows of convections and the convergence lines. However, from the observation of near-surface winds, the outflows are easily overwhelmed by the environmental convergence lines and cannot be clearly distinguished. In future work, the interaction between the outflows of convection and the quasi-stationary convergence line and its effect on the evolution of OWSR systems will be further addressed, with trajectory analysis based on high-resolution numerical simulations.
Acknowledgments. The authors thank Puyuan Du from University of California, Santa Barbara for his support with displaying the radar reflectivity and radial wind speed (http://doi.org/10.5281/zenodo.4031200).
Fig.
12.
Schematic diagrams of (a–d) the ACR synoptic situation [(a, b) 850 hPa and (c, d) mean sea-level], (e–g) convergence/convective lines and vertical wind profiles, and (h, i) OWSR distribution near (a, c, e, h) BGG and (b, d, f, g, i) YJ.
Fig.
1.
(a) Distribution of surface (gray dots), radiosonde (black rectangles), and radar (black filled circles) stations in Guangxi (GX) and Guangdong (GD) in South China. (b) Distribution of orography (gray shading; m) near the border area between Guangxi and Guangdong (BGG) and the Yangjiang (YJ) area in western Guangdong. The numbers such as “59431” in (a) denote radiosonde station IDs, and the thick lines in (b) outline the mountain ranges.
Fig.
2.
Distributions of accumulated rainfall (color shading; mm) and averaged wind vector (m s−1) near the surface for the OWSR events near (a) BGG and (b) YJ in the ACR situation. (a) and (b) are based on seven and eight OWSR events, respectively. The red lines indicate the mountain ranges depicted in Fig. 1b, and the dashed black lines indicate convergence lines. The parallelogram and rectangle in (a) and (b) indicate the average areas for the vertical profiles of wind vector and zonal wind speed shown in Figs. 11a, b, respectively.
Fig.
3.
The average (a1, a2) 850-hPa and (b1, b2) mean-sea-level circulations for the OWSR events near (a1, b1) BGG and (a2, b2) YJ in the ACR situation. The contours in (a1) and (a2) indicate geopotential height (gpm), and the color-graded areas and vectors indicate wind speed (a1, a2; m s−1) or pressure (b1, b2; hPa) and wind vector (m s−1), respectively.
Fig.
4.
Vertical sections of (a, b) wind vector (m s−1) and meridional wind speed (color shading; m s−1), (c, d) relative humidity (color shading; %), (e, f) pseudo-equivalent potential temperature (θ; color shading; K), and (g, h) convective available potential energy (CAPE; color shading; J kg−1) and free convection level (LFC; contour; km) averaged for the OWSR events near (a, c, e, g) BGG and (b, d, f, h) YJ.
Fig.
5.
Evolution of combined radar reflectivity mosaic (color shading; dBZ) for the OWSR events near BGG in the ACR situation. (a1–a4) 1600–1730 BT 6 April 2012, (b1–b4) 1400–1530 BT 16 April 2012, (c1–c4) 1630–1800 BT 1 June 2012, (d1–d4) 0630–1100 BT 1 May 2014, (e1–e4) 1500–1630 BT 2 May 2014, (f1–f4) 0130–0730 BT 24 April 2015, and (g1–g4) 0030–0500 BT 5 May 2015. The gray-shaded areas indicate the orography higher than 100 m. The arrows indicate the approximate motion directions of the convective systems.
Fig.
6.
As in Fig. 5, but for YJ. (a1–a4) 1700–2000 BT 3 May 2011, (b1–b4) 0330–0800 BT 14 May 2011, (c1–c4) 2330 BT 16 April–0230 BT 17 April 2012, (d1–d4) 1800–2230 BT 9 April 2013, (e1–e4) 1330–1630 BT 2 May 2013, (f1–f4) 1500–1800 BT 11 May 2013, (g1–g4) 1300–1600 BT 24 May 2015, and (h1–h4) 1200–1330 BT 11 April 2016.
Fig.
7.
Distributions of near-surface temperature (color shading; °C) and wind vector (m s−1; larger than 0.5 m s−1) before initiation of the OWSR systems near BGG in the ACR situation. (a) 1500 BT 6 April 2012, (b) 1400 BT 16 April 2012, (c) 1600 BT 1 June 2012, (d) 0400 BT 1 May 2014, (e) 1400 BT 2 May 2014, (f) 0000 BT 24 April 2015, and (g) 0200 BT 5 May 2015. The dashed lines indicate convergence lines, near which the near-surface wind directions are indicated with blue and red arrows. The ellipses indicate the trigger sites of the OWSR systems.
Fig.
8.
Distributions of near-surface temperature (color shading; °C) and wind vector (m s−1; larger than 0.5 m s−1) before initiation of the OWSR systems near YJ in the ACR situation. (a) 1900 BT 3 May 2011, (b) 0400 BT 14 May 2011, (c) 0300 BT 17 April 2012, (d) 1800 BT 9 April 2013, (e) 1400 BT 2 May 2013, (f) 1400 BT 11 May 2013, (g) 1300 BT 24 May 2015, and (h) 1200 BT 11 April 2016. The solid gray lines indicate the mountain ranges, and the dashed lines indicate convergence lines, near which the near-surface wind directions are indicated with blue and red arrows. The ellipses indicate the trigger sites of the OWSR systems.
Fig.
9.
Distributions of (a, c, f) low-level circulation (contour: geopotential height, gpm; vector: wind, m s−1) at (a) 850 and (c, f) 1000 hPa; (b, d, g) radar radial wind speed (color shading; m s−1); and (e, h) radar reflectivity (color shading; dBZ) during the initiation of the OWSR systems shown in (a, b) Fig. 7d, (c–e) Fig. 8b, and (f–h) Fig. 8d. (a, b) 0200 and 0814 BT 1 May 2014; (c–e) 0200, 0000, and 0000 BT 14 May 2011; and (f–h) 2000, 1800, and 1800 BT 9 April 2013. The red lines and the green rectangles in (a, c, f) indicate the locations of low-level convergence lines and radar stations, respectively. The white/black and blue vectors in (b, d, g) indicate the low-level wind directions and the approximate motion directions of convective systems, respectively. The red lines in (b, d, e, g, h) indicate the locations of convective systems.
Fig.
10.
Distributions of wind vector (larger than 0.5 m s−1; m s−1) and northerly wind speed (contour; m s−1) near the surface during initiation of the OWSR systems near YJ in the ACR situation. (a) 1900 BT 3 May 2011, (b) 0400 BT 14 May 2011, (c) 0300 BT 17 April 2012, (d) 1800 BT 9 April 2013, (e) 1400 BT 2 May 2013, (f) 1400 BT 11 May 2013, (g) 1300 BT 24 May 2015, and (h) 1200 BT 11 April 2016. The blue-shaded areas indicate the orography higher than 100 m, and the rectangle in (a) indicates the location of YJ. The dashed lines indicate convergence lines, and the arrows indicate the approximate flow paths beside the mountains near YJ.
Fig.
11.
(a, b) Vertical profiles of wind vector (m s−1) and zonal wind speed (color shading; m s−1), and (c, d) hodographs of low-level average easterly/southwesterly wind (black marks) and upper-level average westerly wind (red marks) for the OWSR events near (a, c) BGG and (b, d) YJ in the ACR situation. The vertical profiles of wind vector and zonal wind speed near (a) BGG and (b) YJ are averaged over 3 h during the OWSR events and the rectangle areas shown in Figs. 2a, b, respectively. The low-level easterly (southwesterly) winds are defined as the winds below the boundary between easterly and westerly winds (700 hPa), and the upper-level westerly winds are defined as the winds between the boundary (700 hPa) and 300 hPa. The black and red ellipses “LLWs” and “ULWs” in (c) and (d) indicate the approximate wind direction quadrants of the low-level average easterly/southwesterly winds and the upper-level average westerly winds, respectively.
Bao, X. H., Y. L. Luo, J. X. Sun, et al., 2017: Assimilating Doppler radar observations with an ensemble Kalman filter for convection-permitting prediction of convective development in a heavy rainfall event during the pre-summer rainy season of south China. Sci. China Earth Sci., 60, 1866–1885. doi: 10.1007/s11430-017-9076-9
Barthlott, C., and D. J. Kirshbaum, 2013: Sensitivity of deep convection to terrain forcing over Mediterranean islands. Quart. J. Roy. Meteor. Soc., 139, 1762–1779. doi: 10.1002/qj.2089
Birch, C. E., M. J. Roberts, L. Garcia-Carreras, et al., 2015: Sea-breeze dynamics and convection initiation: The influence of convective parameterization in weather and climate model biases. J. Climate, 28, 8093–8108. doi: 10.1175/JCLI-D-14-00850.1
Bluestein, H. B., and M. H. Jain, 1985: Formation of mesoscale lines of pirecipitation: Severe squall lines in Oklahoma during the spring. J. Atmos. Sci., 42, 1711–1732. doi: 10.1175/1520-0469(1985)042<1711:FOMLOP>2.0.CO;2
Chen, G. X., R. Y. Lan, W. X. Zeng, et al., 2018: Diurnal variations of rainfall in surface and satellite observations at the monsoon coast (South China). J. Climate, 31, 1703–1724. doi: 10.1175/JCLI-D-17-0373.1
Chen, X. C., F. Q. Zhang, and K. Zhao, 2016: Diurnal variations of the land–sea breeze and its related precipitation over South China. J. Atmos. Sci., 73, 4793–4815. doi: 10.1175/JAS-D-16-0106.1
Chen, X. C., F. Q. Zhang, and K. Zhao, 2017: Influence of monsoonal wind speed and moisture content on intensity and diurnal variations of the Mei-Yu season coastal rainfall over south China. J. Atmos. Sci., 74, 2835–2856. doi: 10.1175/JAS-D-17-0081.1
Chen, X. C., K. Zhao, and M. Xue, 2014: Spatial and temporal characteristics of warm season convection over Pearl River Delta region, China, based on 3 years of operational radar data. J. Geophys. Res. Atmos., 119, 12447–12465. doi: 10.1002/2014JD021965
Cheng, A. N., 2005a: Organization of mesoscale convective systems: 1. Numerical experiments. J. Geophys. Res. Atmos., 110, D15S11. doi: 10.1029/2004JD005444
Cheng, A. N., 2005b: Organization of mesoscale convective systems: 2. Linear theory. J. Geophys. Res. Atmos., 110, D15S12. doi: 10.1029/2004JD005450
Darby, L. S., R. M. Banta, and R. A. Pielke Sr., 2002: Comparisons between mesoscale model terrain sensitivity studies and Doppler lidar measurements of the sea breeze at Monterey Bay. Mon. Wea. Rev., 130, 2813–2838. doi: 10.1175/1520-0493(2002)130<2813:CBMMTS>2.0.CO;2
Davis, R. S., 2001: Flash flood forecast and detection methods. Severe Convective Storms, C. A. Doswell III, Ed., American Meteorological Society, Boston, 481–525, doi: 10.1007/978-1-935704-06-5_12.
Ding, Y. H., 1994: Monsoons over China. Kluwer Academic, Dordrecht, 420 pp.
Doswell III, C. A., H. E. Brooks, and R. A. Maddox, 1996: Flash flood forecasting: An ingredients-based methodology. Wea. Forecasting, 11, 560–581. doi: 10.1175/1520-0434(1996)011<0560:FFFAIB>2.0.CO;2
Du, Y., and G. X. Chen, 2018: Heavy rainfall associated with double low-level jets over southern China. Part I: Ensemble-based analysis. Mon. Wea. Rev., 146, 3827–3844. doi: 10.1175/MWR-D-18-0101.1
Du, Y., and R. Rotunno, 2018: Diurnal cycle of rainfall and winds near the south coast of China. J. Atmos. Sci., 75, 2065–2082. doi: 10.1175/JAS-D-17-0397.1
Du, Y., and G. X. Chen, 2019: Heavy rainfall associated with double low-level jets over southern China. Part II: Convection initiation. Mon. Wea. Rev., 147, 543–565. doi: 10.1175/MWR-D-18-0102.1
Du, Y., G. X. Chen, B. Han, et al., 2020a: Convection initiation and growth at the coast of South China. Part I: Effect of the marine boundary layer jet. Mon. Wea. Rev., 148, 3847–3869. doi: 10.1175/MWR-D-20-0089.1
Du, Y., G. X. Chen, B. Han, et al., 2020b: Convection initiation and growth at the coast of South China. Part II: Effects of the terrain, coastline, and cold pools. Mon. Wea. Rev., 148, 3871–3892. doi: 10.1175/MWR-D-20-0090.1
Furtado, K., P. R. Field, Y. L. Luo, et al., 2018: Cloud microphysical factors affecting simulations of deep convection during the presummer rainy season in southern China. J. Geophys. Res. Atmos., 123, 10477–10505. doi: 10.1029/2017JD028192
Furtado, K., P. Field, Y. L. Luo, et al., 2020: The effects of cloud–aerosol interaction complexity on simulations of presummer rainfall over southern China. Atmos. Chem. Phys., 20, 5093–5110. doi: 10.5194/acp-20-5093-2020
He, L. F., T. Chen, and Q. Kong, 2016: A review of studies on prefrontal torrential rain in South China. J. Appl. Meteor. Sci., 27, 559–569. (in Chinese) doi: 10.11898/1001-7313.20160505
Huang, L., and Y. L. Luo, 2017: Evaluation of quantitative precipitation forecasts by TIGGE ensembles for South China during the presummer rainy season. J. Geophys. Res. Atmos., 122, 8494–8516. doi: 10.1002/2017JD026512
Huang, S. S., 1986: Rain Storms in South China in Early Summer. Guangdong Science and Technology Press, Guangzhou, 9–10. (in Chinese)
Huang, Y. J., Y. B. Liu, Y. W. Liu, et al., 2019: Mechanisms for a record-breaking rainfall in the coastal metropolitan city of Guangzhou, China: Observation analysis and nested very large eddy simulation with the WRF model. J. Geophys. Res. Atmos., 124, 1370–1391. doi: 10.1029/2018JD029668
Jiang, Z. N., D.-L. Zhang, R. D. Xia, et al., 2017: Diurnal variations of presummer rainfall over southern China. J. Climate, 30, 755–773. doi: 10.1175/JCLI-D-15-0666.1
Li, Y. P., and R. E. Carbone, 2015: Offshore propagation of coastal precipitation. J. Atmos. Sci., 72, 4553–4568. doi: 10.1175/JAS-D-15-0104.1
Liang, Q. Q., S. X. Xiang, L. G. Lin, et al., 2012: MCS characteristics over South China during the annually first rainy season and their organization types. J. Trop. Meteor., 28, 541–551. (in Chinese)
Liang, Z. M., R. G. Fovell, and Y. Liu, 2019: Observational analysis of the characteristics of the synoptic situation and evolution of the organized warm-sector rainfall in the coastal region of South China in the pre-summer rainy season. Atmosphere, 10, 722. doi: 10.3390/atmos10110722
Lin, L. X., 2006: Technical Guidance on Weather Forecating in Guangdong Province. China Meteorological Press, Beijing, 526 pp. (in Chinese)
Liu, X., Y. L. Luo, Z. Y. Guan, et al., 2018: An extreme rainfall event in coastal South China during SCMREX-2014: Formation and roles of rainband and echo trainings. J. Geophy. Res. Atmos., 123, 9256–9278. doi: 10.1029/2018JD028418
Luo, Y. L., R. H. Zhang, Q. L. Wan, et al., 2017: The Southern China Monsoon Rainfall Experiment (SCMREX). Bull. Amer. Meteor. Soc., 98, 999–1013. doi: 10.1175/BAMS-D-15-00235.1
Mu, J. L., J. J. Wang, and Z. C. Li, 2008: A study of environment and mesoscale convective systems of continuous heavy rainfall in the south of China in June 2005. Acta Meteor. Sinica, 66, 437–451. (in Chinese)
Ni, Y. Q., R. H. Zhang, L. P. Liu, et al., 2013: South China Heavy Rainfall Field Experiment. China Meteorological Press, Beijing, 299 pp. (in Chinese)
Parker, M. D., 2007: Simulated convective lines with parallel stratiform precipitation. Part II: Governing dynamics and associated sensitivities. J. Atmos. Sci., 64, 289–313. doi: 10.1175/JAS3854.1
Parker, M. D., and R. H. Johnson, 2000: Organizational modes of midlatitude mesoscale convective systems. Mon. Wea. Rev., 128, 3413–3436. doi: 10.1175/1520-0493(2001)129<3413:OMOMMC>2.0.CO;2
Qian, Q. F., Y. L. Lin, Y. L. Luo, et al., 2018: Sensitivity of a simulated squall line during Southern China Monsoon Rainfall Experiment to parameterization of microphysics. J. Geophys. Res. Atmos., 123, 4197–4220. doi: 10.1002/2017JD027734
Ren, Z. H., Z. F. Zhang, C. Sun, et al., 2015: Development of three-step quality control system of real-time observation data from AWS in China. Meteor. Mon., 41, 1268–1277. (in Chinese)
Schumacher, R. S., and R. H. Johnson, 2005: Organization and environmental properties of extreme-rain-producing mesoscale convective systems. Mon. Wea. Rev., 133, 961–976. doi: 10.1175/MWR2899.1
Wang, H. Y., L. P. Liu, G. L. Wang, et al., 2009: Development and application of the Doppler weather radar 3-D digital mosaic system. J. Appl. Meteor. Sci., 20, 214–224. (in Chinese) doi: 10.3969/j.issn.1001-7313.2009.02.011
Wang, H., Y. L. Luo, and B. J.-D. Jou, 2014: Initiation, maintenance, and properties of convection in an extreme rainfall event during SCMREX: Observational analysis. J. Geophys. Res. Atmos., 119, 13206–13232. doi: 10.1002/2014JD022339
Weisman, M. L., J. B. Klemp, and R. Rotunno, 1988: Structure and evolution of numerically simulated squall lines. J. Atmos. Sci., 45, 1990–2013. doi: 10.1175/1520-0469(1988)045<1990:SAEONS>2.0.CO;2
Wu, M. W., and Y. L. Luo, 2016: Mesoscale observational analysis of lifting mechanism of a warm-sector convective system producing the maximal daily precipitation in China mainland during pre-summer rainy season of 2015. J. Meteor. Res., 30, 719–736. doi: 10.1007/s13351-016-6089-8
Wu, M. W., Y. L. Luo, F. Chen, et al., 2019: Observed link of extreme hourly precipitation changes to urbanization over coastal South China. J. Appl. Meteor. Climatol., 58, 1799–1819. doi: 10.1175/JAMC-D-18-0284.1
Xu, Y., J. H. Yan, Q. Q. Wang, et al., 2013: A low-level gravity wave triggering mechanism for rainstorm of warm zone in South China. Plateau Meteor., 32, 1050–1061. (in Chinese)
Zhang, R. H., Y. Q. Ni, L. P. Liu, et al., 2011: South China heavy rainfall experiments (SCHeREX). J. Meteor. Soc. Japan., 89A, 153–166. doi: 10.2151/jmsj.2011-A10
Zhang, X. B., 2018: Application of a convection-permitting ensemble prediction system to quantitative precipitation forecasts over southern China: Preliminary results during SCMREX. Quart. J. Roy. Meteor. Soc., 144, 2842–2862. doi: 10.1002/qj.3411
Zhang, X. B., 2019: Multiscale characteristics of different-source perturbations and their interactions for convection-permitting ensemble forecasting during SCMREX. Mon. Wea. Rev., 147, 291–310. doi: 10.1175/MWR-D-18-0218.1
Zhang, X. B., Y. L. Luo, Q. L. Wan, et al., 2016: Impact of assimilating wind profiling radar observations on convection-permitting quantitative precipitation forecasts during SCMREX. Wea. Forecasting, 31, 1271–1292. doi: 10.1175/WAF-D-15-0156.1
Zhao, S. X., N. F. Bei, and J. H. Sun, 2007: Mesoscale analysis of a heavy rainfall event over Hong Kong during a pre-rainy season in South China. Adv. Atmos. Sci., 24, 555–572. doi: 10.1007/s00376-007-0555-2
Zhong, S. X., and Z. T. Chen, 2017: The impacts of atmospheric moisture transportation on warm sector torrential rains over South China. Atmosphere, 8, 116. doi: 10.3390/atmos8070116
Zhou, X. J., J. S. Xue, Z. Y. Tao, et al., 2003: Scientific Test Study of Rainstorms in Huanan in 1998. China Meteorological Press, Beijing, 370 pp. (in Chinese)
Liang, Z. M., and S. T. Gao, 2021: Organized warm-sector rainfall in the coastal region of South China in an anticyclone synoptic situation: Observational analysis. J. Meteor. Res., 35(3), 460–477, doi: 10.1007/s13351-021-0157-4.
Liang, Z. M., and S. T. Gao, 2021: Organized warm-sector rainfall in the coastal region of South China in an anticyclone synoptic situation: Observational analysis. J. Meteor. Res., 35(3), 460–477, doi: 10.1007/s13351-021-0157-4.
Liang, Z. M., and S. T. Gao, 2021: Organized warm-sector rainfall in the coastal region of South China in an anticyclone synoptic situation: Observational analysis. J. Meteor. Res., 35(3), 460–477, doi: 10.1007/s13351-021-0157-4.
Citation:
Liang, Z. M., and S. T. Gao, 2021: Organized warm-sector rainfall in the coastal region of South China in an anticyclone synoptic situation: Observational analysis. J. Meteor. Res., 35(3), 460–477, doi: 10.1007/s13351-021-0157-4.
Export: BibTexEndNote
Article Metrics
Article views: 872 PDF downloads: 64Cited by:
Manuscript History
Received: 28 September 2020
Available online: 08 February 2021
Final form: 19 January 2021
Issue in Progress: 01 May 2021
Published online: 24 June 2021
Share
Catalog
Abstract
摘要
1.
Introduction
2.
Data and methodology
3.
The key factor of the ACR situation
4.
Effects of the key factor on the trigger processes of OWSR systems
5.
Effects of the key factor on the propagation processes of OWSR systems


 DownLoad: