Spatial Distribution and Temporal Trend Characteristics of Agro-Climatic Resources and Extreme Climate Events during the Soybean Growing Season in Northeast China from 1981 to 2017
Soybean is an important oil crop. Agro-climatic resources and extreme climate events during the growing season directly affect the crop growth and grain yield. In this study, we used historical climate data and phenology observation data to investigate the spatial distributions and temporal trends of agro-climatic resources and extreme climate events during the growing season for soybean in Northeast China (NEC). The results showed that during the soybean growing season, the thermal time increased while both the effective precipitation and photosynthetically active radiation (PAR) decreased. Within the growing season, the thermal time increased by 44.0°C day decade–1 during the vegetative stage but decreased by 16.5°C day decade–1 during the reproductive stage; the effective precipitation increased by 1.8 mm decade–1 during the vegetative stage but decreased by 7.3 mm decade–1 during the reproductive stage; PAR decreased by 6.5 and 11.9 MJ m–2 decade–1 during the vegetative and reproductive stages. The frequency of extreme cold days showed a decreasing trend during the four study phases of sowing to emergence, sowing–flowering, 15 days before flowering–flowering, and pod to physiological maturity. During the soybean growing season, the frequency of extreme heat days and the maximum number of consecutive dry days (CDD) increased, and the maximum number of consecutive wet days (CWD) and heavy precipitation days decreased. The results of this study could be used in selecting optimal management in soybean production in order to take advantage of beneficial climatic elements.
Climate change has been a well-known fact (IPCC, 2014). From 1960 to 2014, China’s average surface temperature increased at a rate of 0.25°C decade–1, and the annual precipitation fluctuated more greatly. Furthermore, climate change on the regional scale vary greatly (Fang et al., 2018; Zhu et al., 2020). Among all the regions in China, Northeast China (NEC) was affected the most by climate change (Liu et al., 2009). Since 1961, NEC’s average air temperature has been increasing at a rate of 0.30°C decade–1, regional daily sunshine hours decreasing at a rate of 3.5 h decade–1, and annual precipitation decreasing by 12% (Hu et al., 2016; Zhang et al., 2016). Changes of climate elements (e.g., air temperature, precipitation, and solar radiation) in NEC can affect the crop growth and yield formation (Bellon et al., 2011). For example, the rising air temperature could shorten the grain-filling period by accelerating the growth and deve-lopment of crop plants (Mall et al., 2004), and the decreasing precipitation puts the rain-fed crop plants at a higher risk of water stress (Qin et al., 2013). Both of the two above-mentioned climatic trends could potentially sabotage the final crop yield. In addition, climate change has led to changes in extreme climate events in NEC. For example, the frequency of days with extreme cold (heat) has been significantly decreasing (increasing); the consecutive dry days (CDD; a drought indicator) showed a significantly increasing trend; and heavy precipitation and consecutive precipitation days showed a decreasing trend in NEC (Wang et al., 2013; Guo et al., 2019). Extreme weather events during the growing season can also affect the crop growth and yield formation (Shi et al., 2014). In particular, for thermophilic crops, extreme cold in the growing season causes cold damage and extreme heat reduces photosynthesis rate, which finally reduce the crop yield (Southworth et al., 2002). It is imperative to document the agro-climatic resources and extreme climate events in the crop growth season.
Soybean is one of the world’s major and fast-expanding oil crops (Rose et al., 2016). In 2018, the worldwide harvest area was 1.24 × 10⁸ ha and the yield were 3.49 × 10⁸ tons (FAO; http://www.fao.org/faostat/zh/#data/QC). China is the world’s fourth largest soybean producer (Wei, 2019). In China, NEC is one of the main soybean production regions. Under global warming, climatic conditions have been changing significantly and then lead to changes of agro-climate resources and extreme climate events during the soybean growing season. From 1981 to 2010 in China, air temperature increased by 0.20–0.66°C decade–1 and sunshine hours decreased by 2.64–6.41 h decade–1 during the soybean growing season, precipitation increased by 4.14–7.87 mm decade–1 during the vegetative stage but decreased by 1.34–14.27 mm decade–1 during the reproductive stage (He et al., 2020). In NEC, air temperature has been significantly increasing during the thermophilic crop growing season (soybean is a thermophilic legume), and this warming trend is projected to continue under future climate scenarios, from 1951 to 2005, no less than 10°C accumulated temperature increased by 69°C day decade–1 during the thermophilic crop growing season in NEC (Chu et al., 2017). In the northern part of NEC, no less than 10°C accumulated temperature (precipitation) increased (decreased) by 135.8°C day decade–1 (43.2 mm decade–1) during the actual flowering-maturity phase from 1980 to 2008 (Jiang et al., 2011). From 1961 to 2010, effective precipitation during the soybean growing season decreased by 6.21 mm decade–1 in NEC, which was mainly caused by the reduction in effective precipitation during the reproductive stage (at a rate of 7.47 mm decade–1). By contrast, the effective precipitation slightly increased during the vegetative stage (Hu et al., 2017). For soybean in NEC, so-lar radiation decreased before, during, and after flowering, at the rate of 0.26, 0.29, and 0.08 MJ m−2 decade–1, respectively (Yin et al., 2016). During the thermophilic crop growing season in NEC, the frequency of days with extreme cold significantly decreased, which means a lower risk of cold damage for soybean plants (Guo et al., 2019). However, the number of days with extreme heat significantly increased in summer in NEC, which means a higher risk of high temperature/heat damage for soybean plants (Qin et al., 2012). In most parts of NEC, the number of continuous precipitation days showed a decreasing trend and the risk of crop drought has been increasing (Khan et al., 2016). Under future climate scenarios, droughts together with heat stress would be the largest limitation factors for the soybean yield in NEC (Yin et al., 2016).
Previous studies have stated the changes in agro-climatic indices during the growing seasons for wheat, corn, and rice (Sun et al., 2018; Wang et al., 2018; Zhao and Yang, 2018). Few researchers have analyzed changes in the average agro-climatic resources during the soybean growing season, but none has investigated the asymmetric of temporal trends in agro-climatic resources and extreme climate events during the growing season (in other words, during different growing stages). In this study, we used historical weather data from 1981 to 2017 to investigate changes in the thermal time, effective precipitation, and photosynthetically active radiation (PAR) during the actual soybean growing season in NEC. We divided the entire growing season into two stages: vegetative stage (before flowering) and reproductive stage (after flowering). Besides the average agro-climatic resources, we also analyzed extreme climate events like the frequency of days with extreme heat/cold and extreme precipitation days. The goal of this study is to document the spatial distributions and temporal trends in average agro-climatic indices and extreme climate events during the soybean growing season and critical growth phases in NEC.
2.
Materials and methods
2.1
Study area and data
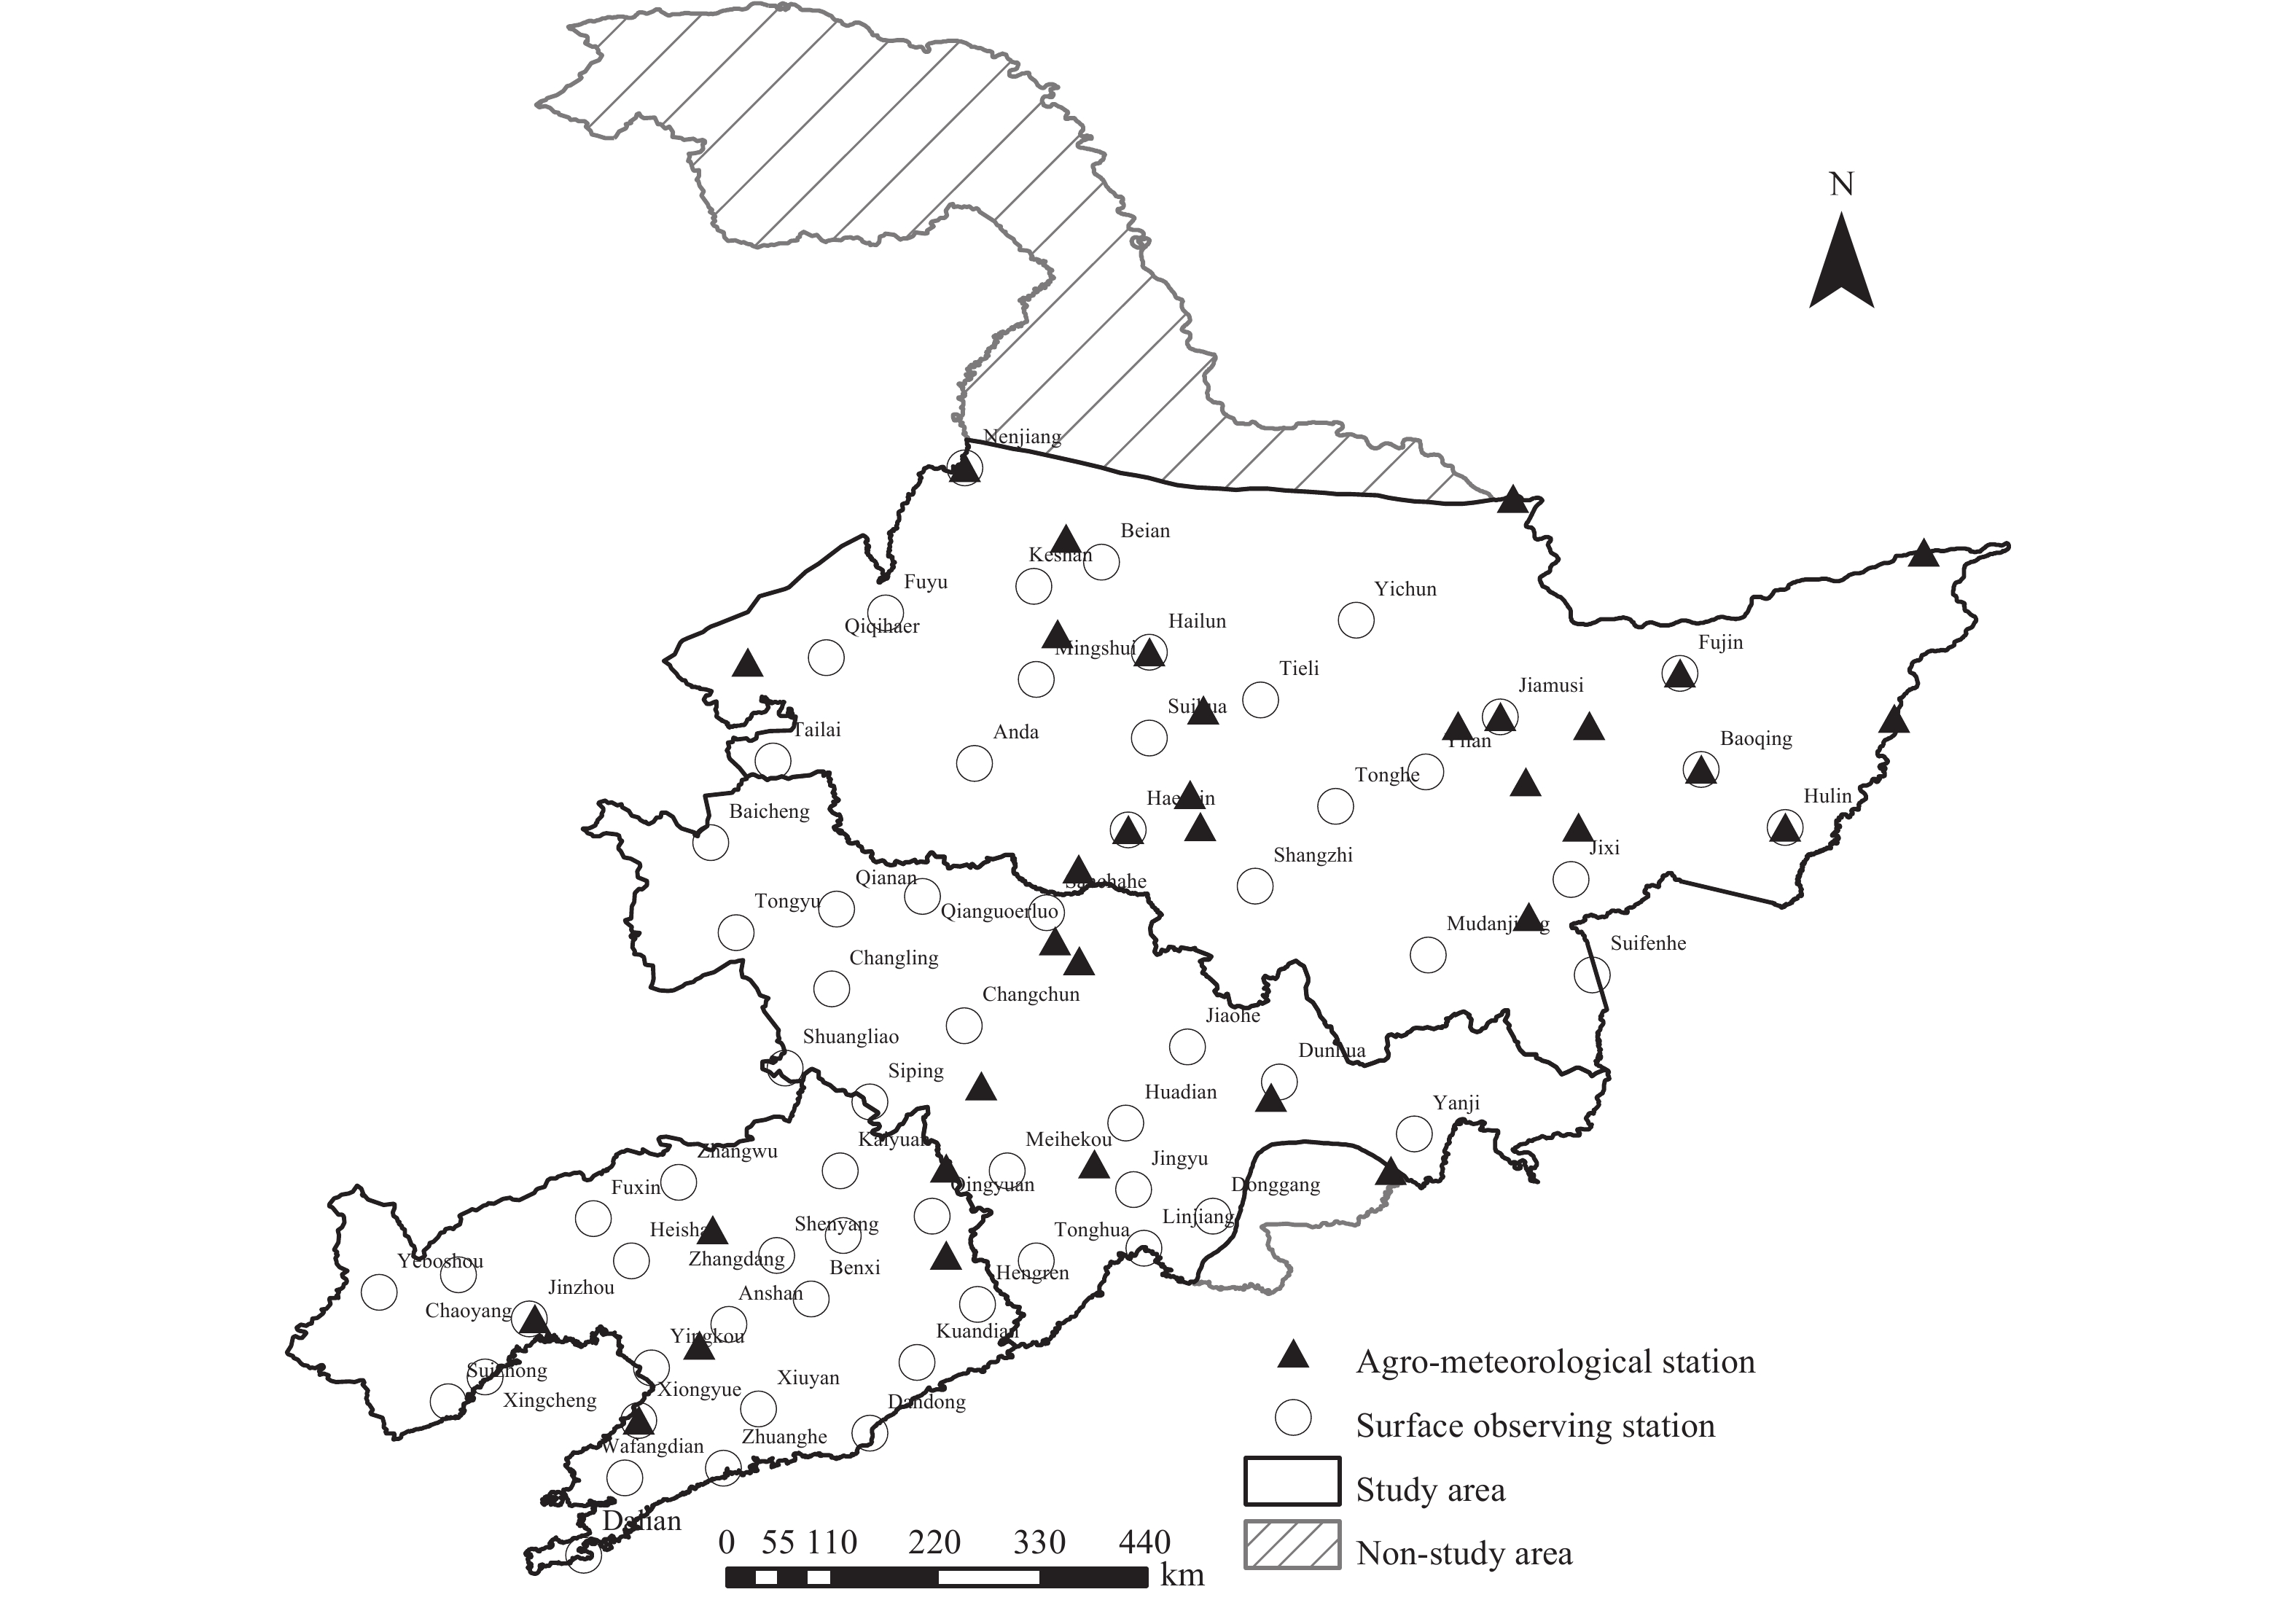
In this study, the research area is NEC, where national soybean production is focused. We determined the study area based on the threshold of growing degree days (GDD) for warm-season crops (2000°C day; Wang et al., 2015; Fig. 1). We obtained historical daily weather data during 1981–2017 from 64 surface observing stations through the China Meteorological Administration (CMA) China Meteorological Data Network (http://data.cma.cn//). The climate factors included the maximum, minimum, and average temperatures; precipitation; and sunshine hours. We acquired the soybean phenology data from 33 agro-meteorological stations in NEC (Fig. 1), including planting, emergence, flowering, beginning pod, and physiological maturity dates. We used the phenology data in 1992 to fill the missing records from 1981 to 1991 for all agro-meteorological stations. For some stations that have a few years of missing records, we used the phenology data in adjacent years instead. In NEC, the altitude of most area was less than 673 m, which implies a minimal effect on crop phenology. Hence, we used the inverse distance weighting (IDW) method in ArcGIS (Geographic Information System) 10.4 to interpolate the site-level phenology data into the entire research area. Based on the daily climate data and soybean phenology data into the entire research area, we computed the indicators of agro-climatic resources and the frequency of extreme weather events during the soybean growing season.
Fig
1.
Locations of the 64 surface observing stations and 33 agro-meteorological stations in NEC.
2.2
Agro-climatic resources
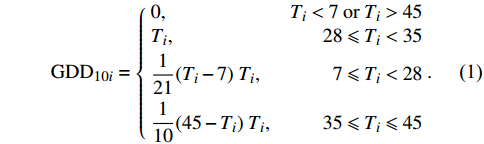
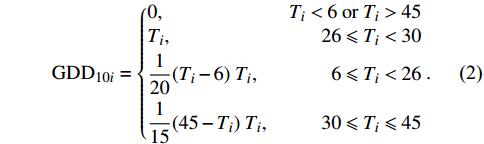
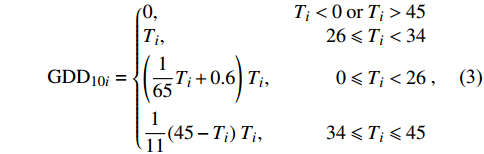
Growing degree days (GDD) is commonly used to quantify the heating resource for crop plants. In this study, we used the method in DSSAT (Decision Support System for Agrotechology Transfer)-CROPGRP (Plant Growth and Partitioning)-Soybean model (https://dssat.net/; Grimm et al., 1993, 1994) to calculate accumulated the effective GDD (GDD10) during the soybean growing season.
where GDD10 (°C day) is the thermal time during a certain period of time; GDD10i (°C day) is the daily thermal time; n (day) is the number of days during a certain period of time; and Ti (°C) is the daily average temperature.
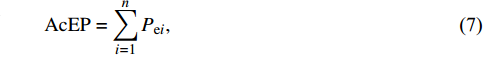
Effective precipitation is the amount of precipitation that is actually added and stored in soil, which equals the total precipitation minus runoff, crop interception, deep leakage, etc. During the growing season, accumulated effective precipitation (AcEP; mm) is the only water resource for rainfed crop plants. In this study, we used the method [Eqs. (5)−(7)] recommended by the U.S. Department of Agriculture Soil Conservation to compute AcEP (Döll and Siebert, 2002). This method was also used in other related studies in NEC and China (Zhao and Yang, 2018; Zhang et al., 2020).
{P_{{\rm{e}}i}} = (4.17 - 0.2P)/4.17, \; \quad P < 8.3\;{\rm{mm}},
(5)
{P_{{\rm{e}}i}} = 4.17 + 0.1P,\; \quad\quad\quad\quad P \geqslant 8.3\;{\rm{mm}},
where Pei (mm) is the daily effective precipitation; P (mm) is the daily precipitation; AcEP (mm) is the accumulated effective precipitation; and n (day) is the number of days during the growing season or growing stage.
PAR (MJ m–2) is the amount of light available for photosynthesis, which is the part of solar radiation that could be intercepted by crop plants to convert to dry matters (a term to measure the yield; Zhao and Yang, 2018). In this study, we converted the daily sunshine hours into daily solar radiation (Rs) with the Ångström formula [Eqs. (8)−(13); Allen et al., 1998].
where Rsi (MJ m−2) is the daily solar radiation on Day i; Ra (MJ m−2) is the clear sky solar radiation; n (h) is the daily sunshine hours; N (h) is the maximum astronomical sunshine hours; ωs (rad) is the sunrise and sunset hour angle; δ (rad) is the sun declination; φ (rad) is the latitude; dr is the relative distance between sun and earth; J is the number of the day in the year between 1 (1 January) and 365 or 366 (31 December); and Gsc (0.082 MJ m−2 min−1) is the solar constant.
In this study, we used AcPAR [Eqs. (14), (15)] at the top of canopy during the growing season to indicate the solar radiation resource for soybean plants (Lizaso et al., 2003). This method has been widely used in crop models and also in previous studies (Zhao and Yang, 2018; Zhang et al., 2020.
where PAR (MJ m−2) is the AcPAR during a certain period of time; n (day) is the number of days during a certain period of time; PARi (MJ m−2) is the daily PAR on Day i; and Rsi (MJ m−2) is the daily solar radiation on Day i.
2.3
Extreme climate events
In this study, we analyzed changes in the extreme climate events that are closely related to the soybean yield in NEC. The indices for extreme climate events include the daily maximum temperature (Tmax), daily minimum temperature (Tmin), diurnal temperature range (DTR; Chen et al., 2020), frequency of extreme heat/cold days, number of heavy precipitation days (P50), CDD, and consecutive wet days (CWD; Table 1). For each of the study locations, we computed the percentage frequency of days with extreme heat/cold events during the corresponding timescales [Eq. (16)].
F = \frac{{{d_{\rm{1}}}}}{{{d_2}}} \times 100{\text% } ,
(16)
where F (%) is the percentage frequency; d1 (day) is the number of extreme climate events days during a certain timescale; and d2 (day) is the number of total days during a certain timescale.
2.4
Methods
In this study, we used the least square method [Eq. (17)] to compute the linear trend in those selected indices for agro-climatic resources and extreme climate events. We presented the decadal trend as 10 times the linear regression coefficient. In addition, we determined the statistical significance of decadal trends in climate indices with a two-tailed t-test in the Kolmogorov–Smirnov (K–S) model (Li et al., 2014).
\hat { x} = at + b, \quad\quad t = 1,2,\ldots,N,
(17)
where \hat { x} is the climate index; a is the linear regression coefficient; b is the intercept; t (yr) is the study year; and N is the number of total study years.
3.
Results
3.1
Changes in soybean phenology
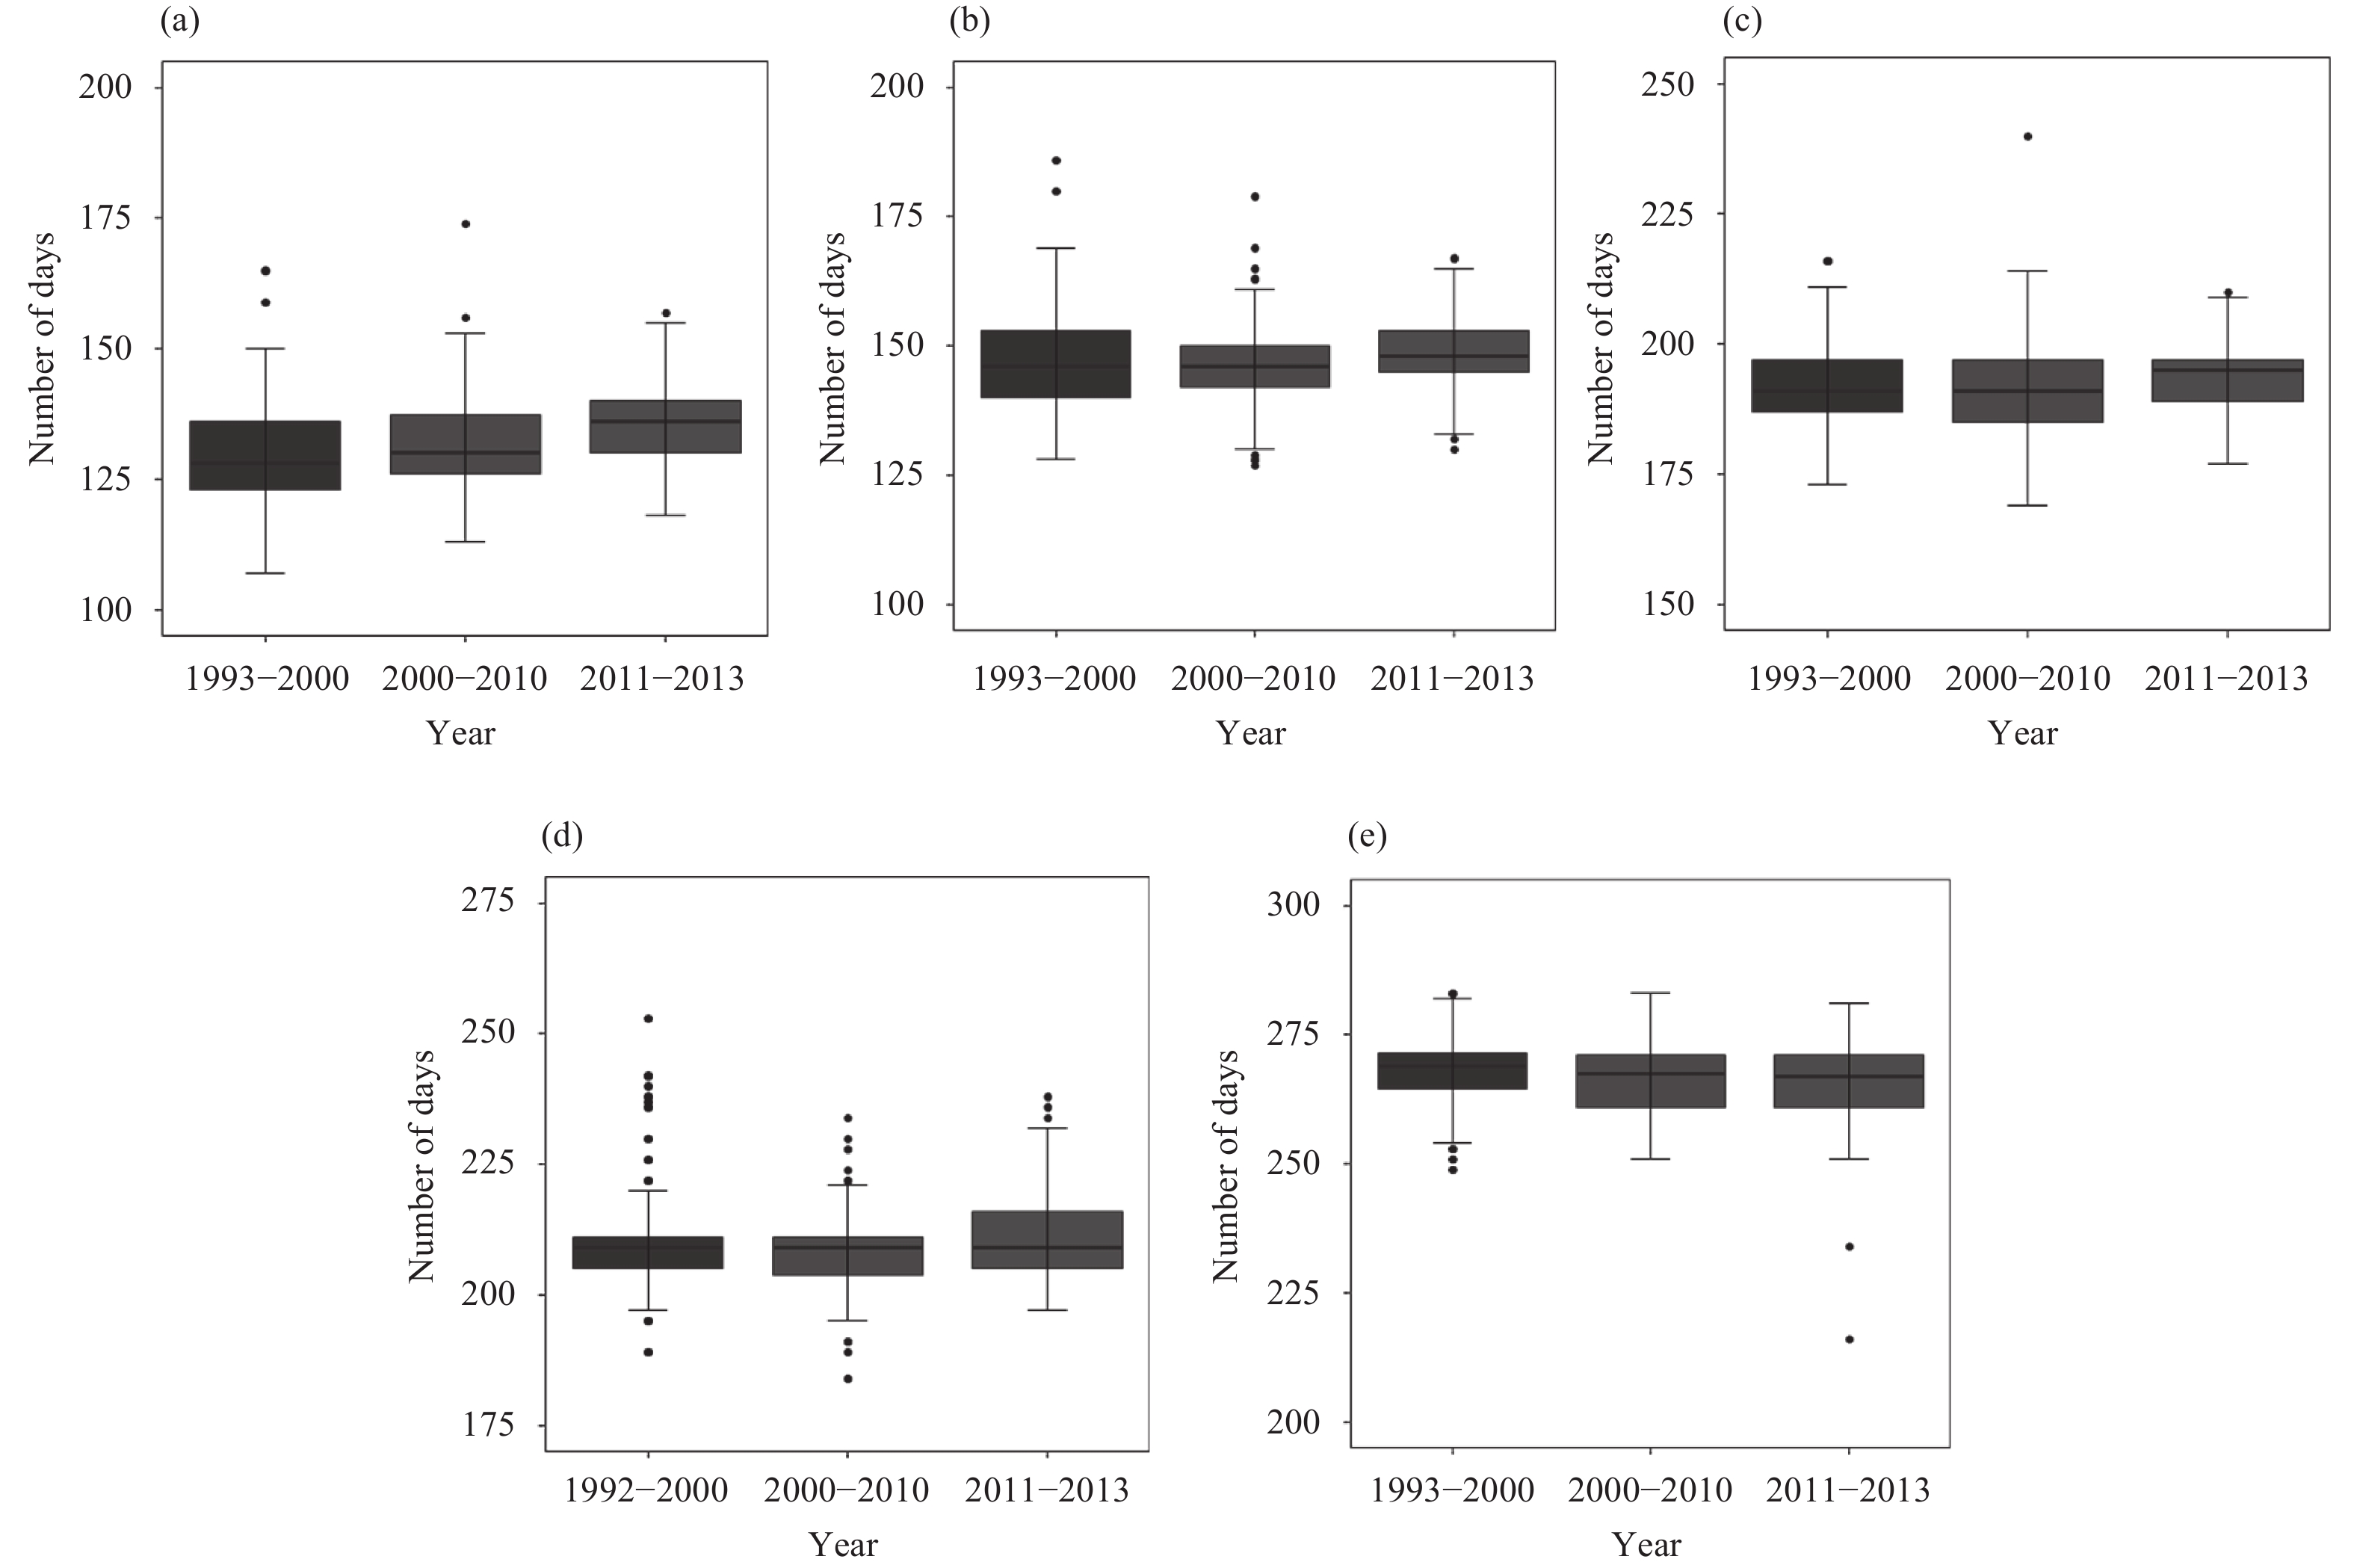
According to the actual soybean phenology data from 1992 to 2013, the sowing, emergence, flowering, and beginning pod dates were delayed by 0.8, 3.8, 0.3, 0.1 day decade–1, respectively. By contrast, the physiological maturity date was advanced by 1.7 day decade–1 (Fig. 2). Overall, the length of the soybean growing season decreased, which was caused by the shortening vegetative and reproductive stages. The amplitude of shortening in the length of the reproductive stage was higher than that in the length of the vegetative stage. Within the soybean growing season, only the length of the sowing–emergence phase showed an increasing trend.
Fig
2.
Time series of soybean phenology from 1992 to 2013 for the 33 agro-meteorological stations in NEC. (a) Sowing date, (b) emergence date, (c) flowering date, (d) beginning pod date, and (e) maturity date.
3.2
Spatial distributions and temporal trends of agro-climatic resources
3.2.1
Spatial distributions of agro-climatic resources
During the three study timescales, GDD10 showed a gradual increase from the northeastern to southwestern of NEC (Figs. 3a, d, g). GDD10 during the soybean growing season was 2112.4°C day on average during the study period. GDD10 was unevenly distributed within the growing season. The average GDD10 was 1351.4°C day during the reproductive stage, which was higher than that during the vegetative stage (760.9°C day). AcEP showed a decrease from the southeastern to the northwestern (Figs. 3b, e, h). AcEP during the soybean growing season was 180.2 mm. In NEC, the reproductive stage for soybean usually coincides with the wet season. Therefore, AcEP during the reproductive stage (103.4 mm) was higher than that during the vegetative stage (76.8 mm), which also had asymmetry distributions during different growing seasons. During the soybean growing season, AcPAR averaged 1234.7 MJ m−2. AcPAR was similar during the vegetative stage (626.1 MJ m−2) to that during the reproductive stage (608.7 MJ m−2), which didn’t have obvious asymmetry distributions. The northwestern part of NEC was more abundant in AcPAR during the soybean growing season than the other parts of the study region (Figs. 3c, f, i).
Fig
3.
Geographical distributions of GDD10, AcEP, and AcPAR during the vegetative stage, reproduction stage, and entire growing season for soybean from 1981 to 2017 in NEC.
Fig
4.
Temporal trends in (a) GDD10, (b) AcEP, and (c) AcPAR during the vegetative stage, reproductive stage, and entire growing season from 1981 to 2017 for the 64 surface observing stations (listed in latitude order on the y-axis) in NEC.
3.2.2
Temporal trends of agro-climatic resources
From 1981 to 2017, the majority of the study locations showed an increase in GDD10 during the soybean growing season (69% are statistically significant at p < 0.05), and the regional composite rate was 42.3°C day decade–1 in NEC. During the growing season, the majority of the study locations showed an increasing trend in GDD10 during the vegetative stage (79.7% are statistically significant at p < 0.05) but a decreasing trend in GDD10 during the reproductive stage (29.7% are statistically significant at p < 0.05). In NEC, GDD10 during the vegetative stage increased by 44.0°C day decade–1 while GDD10 during the reproductive stage decreased by 16.5°C day decade–1. The GDD10 during the vegetative stage increased faster in the southwestern part of NEC than that in the northeastern part, while GDD10 during the reproductive stage increased faster in the northeastern part than that in the southwestern part of NEC. Overall, the within-season difference in the GDD10 trend between vegetative and reproductive stages gradually declined from the southwestern part of NEC to the northeastern part (Figs. 4a, 5a).
Fig
5.
Temporal trends in (a) GDD10, (b) AcEP, and (c) AcPAR during the vegetative stage, reproductive stage, and entire growing season from 1981 to 2017 for the 64 surface observing stations (listed in longitude order on the x-axis) in NEC.
During the soybean growing season, the temporal trend in AcEP was −6.1 mm decade–1 in NEC, with 19% of sites significant. During the vegetative stage, the temporal trend in AcEP was 1.4 mm decade–1 with 6% of sites significant. However, the temporal trend during the reproductive stage was −8.7 mm decade–1 with 55% of sites significant. In the northeastern part of NEC, AcEP during the vegetative stage increased faster than that in the southwestern part, but AcEP during the reproductive stage decreased faster than that in the southwestern part of NEC. As a result, the within-season difference in the AcEP trend between the vegetative and reproductive stages was greater in the northeastern part of NEC than in the southeastern part (Figs. 4b, 5b).
During the soybean growing season, the temporal trend in AcPAR was −18.4 MJ m−2 decade–1, with 61% of sites significant. This decrease was more attributable to the decrease in AcPAR during the reproductive stage than that during the vegetative stage. During the vegetative (reproductive) stage, AcPAR decreased by 6.5 (11.9) MJ m−2 decade–1 in NEC, and 55% (47%) of the sites showed a statistically significant trend. In NEC, the within-season difference in the AcPAR trend was relatively greater in the southeastern and southwestern parts (Figs. 4c, 5c).
3.3
Extreme temperature events
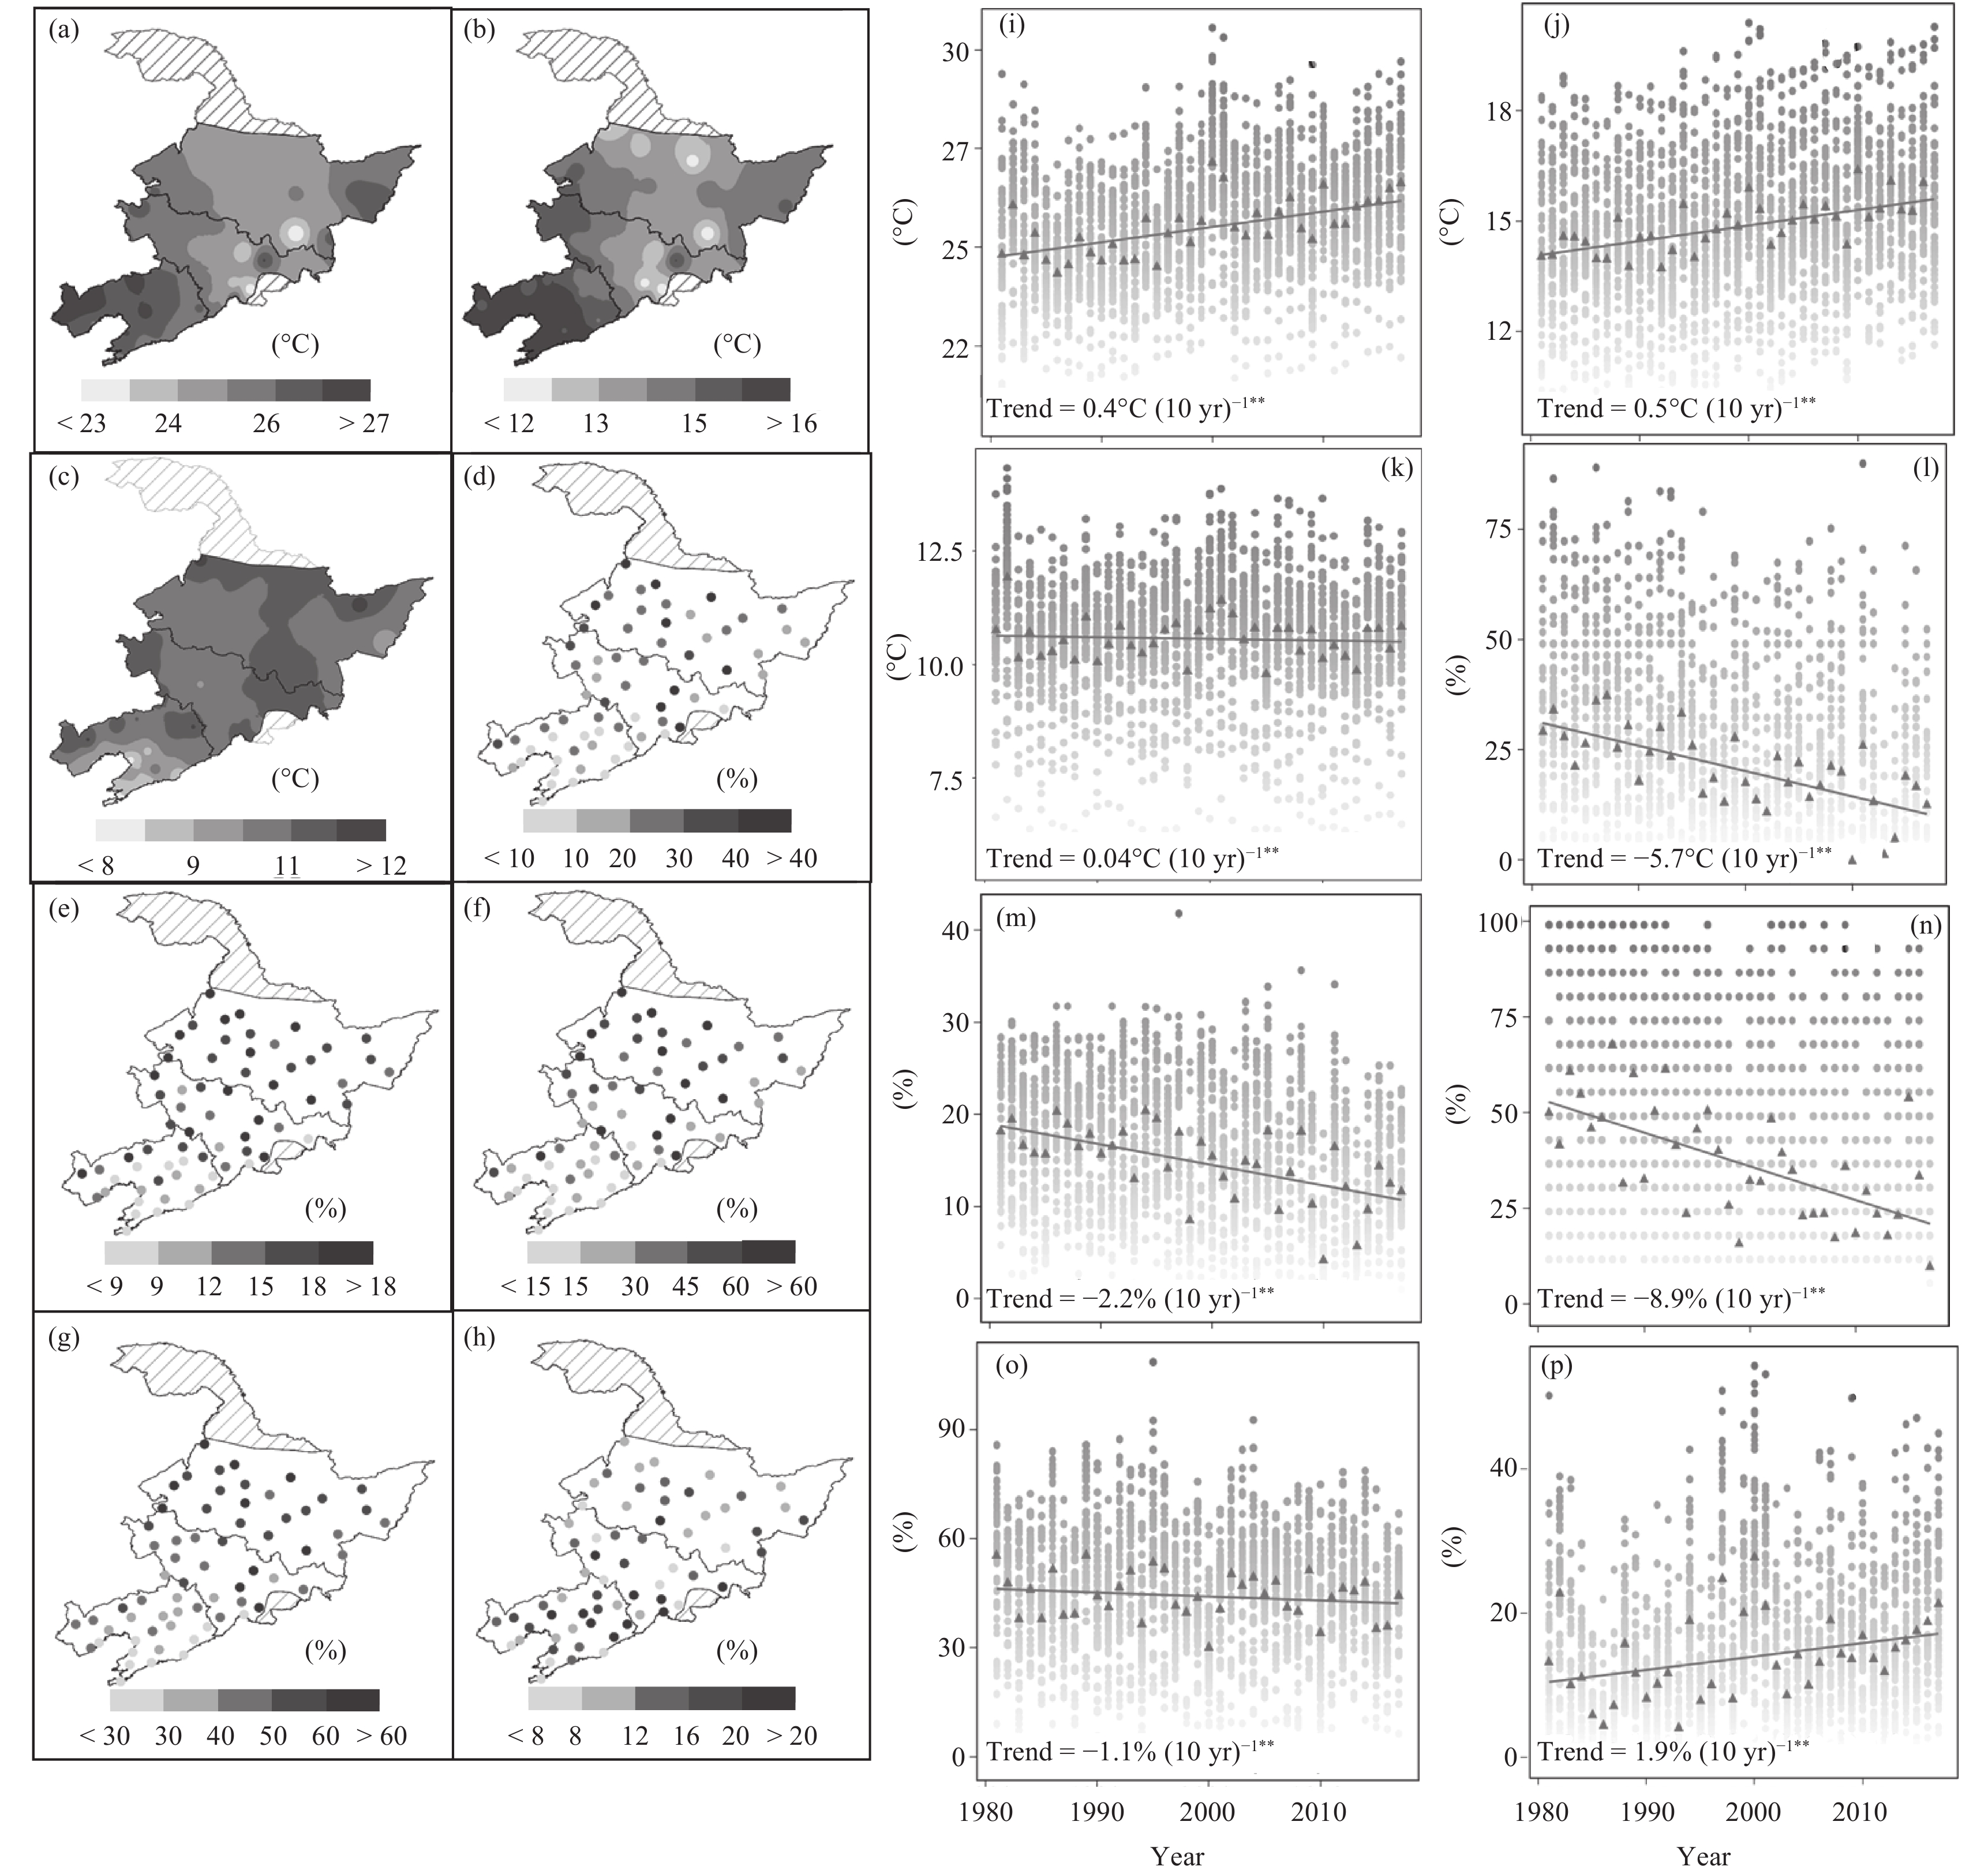
From 1981 to 2017, the frequency of temperature fluctuations increased in NEC. This implies more frequent extreme heat and cold events that could directly affect the growth and development of soybean plants. The spatial distribution of Tmax and Tmin increased from the northeastern to the southwestern part of NEC (Figs. 6a, b). The regional Tmax (Tmin) was 25.5 (14.9)°C during the study period and Tmin (0.5°C decade–1, p < 0.01) increased faster than Tmax (0.5°C decade–1, p < 0.01; Figs. 6i, j). DTR during the soybean growing season increased from the southern to the northern part of NEC, and the regional average was 10.6°C. In NEC, DTR during the soybean growing season decreased by 0.04°C decade–1 (p < 0.01) due to the faster increase in Tmin than Tmax (Figs. 6c, k).
Fig
6.
Geographical distributions of (a) Tmax, (b) Tmin, (c) DTR, (d) EC6, (e) EC10, (f) EC17, (g) EC15, and (h) EH30 during the soybean growing season and two growth stages from 1981 to 2017 in NEC. Temporal trends in (h) Tmax, (i) Tmin, (k) DTR, (l) EC6, (m) EC10, (n) EC17, (o) EC15, and (p) EH30 during the soybean growing season and two growth stages from 1981 to 2017 in NEC. ** indicates that the coefficient of determination is statistically significant at p < 0.01.
The frequency of extreme cold events showed a grad-ual decrease from the northern to southern NEC. In particular, EC15 [the frequency of extreme cold days (daily Tmin < 15°C) from beginning pod to full maturity, which reduced the rate of grain filling], occurred most frequently, with a value of 45.2%. The second was EC17 [the frequency of extreme cold days (daily Tmin < 17°C) from 15 days before flowering to flowering, which caused flower abortion and pod obstruction and then affected the number of seeds and grain weight], with a value of 38.8%. The regional average EC6 [the frequency of extreme cold days (daily Tmin < 6°C) from sowing to emergency, which delayed emergence] and EC10 [the frequency of extreme cold days (daily Tmin < 10°C) during the vegetative stage, which hindering vegetative growth] was 21.7% and 15.2%, respectively (Figs. 6d-g). During the study period, the frequency of extreme cold events during the soybean growing season showed decreasing trends. The temporal trends of EC15 and EC10 were −1.1% and −2.2% decade–1, respectively. EC17 and EC6 showed a significant decrease, with the temporal trends of −8.9% and −5.7% decade–1, respectively (Figs. 6l-o).
As for the extreme heat event, the EH30 was 14.0%. In NEC, EH30 (the frequency of extreme heat days (daily Tmax > 30°C) during the soybean growing season, which reducing photosynthesis rate) was relatively more frequent in the southeastern part than that in other parts (Fig. 6h). EH30 could affect the photosynthesis rate of soybean plants, which is essential for dry matter formation. During the study period, there was a significant increase in EH30 (1.9% decade–1; Fig. 6n).
3.4
Extreme precipitation events
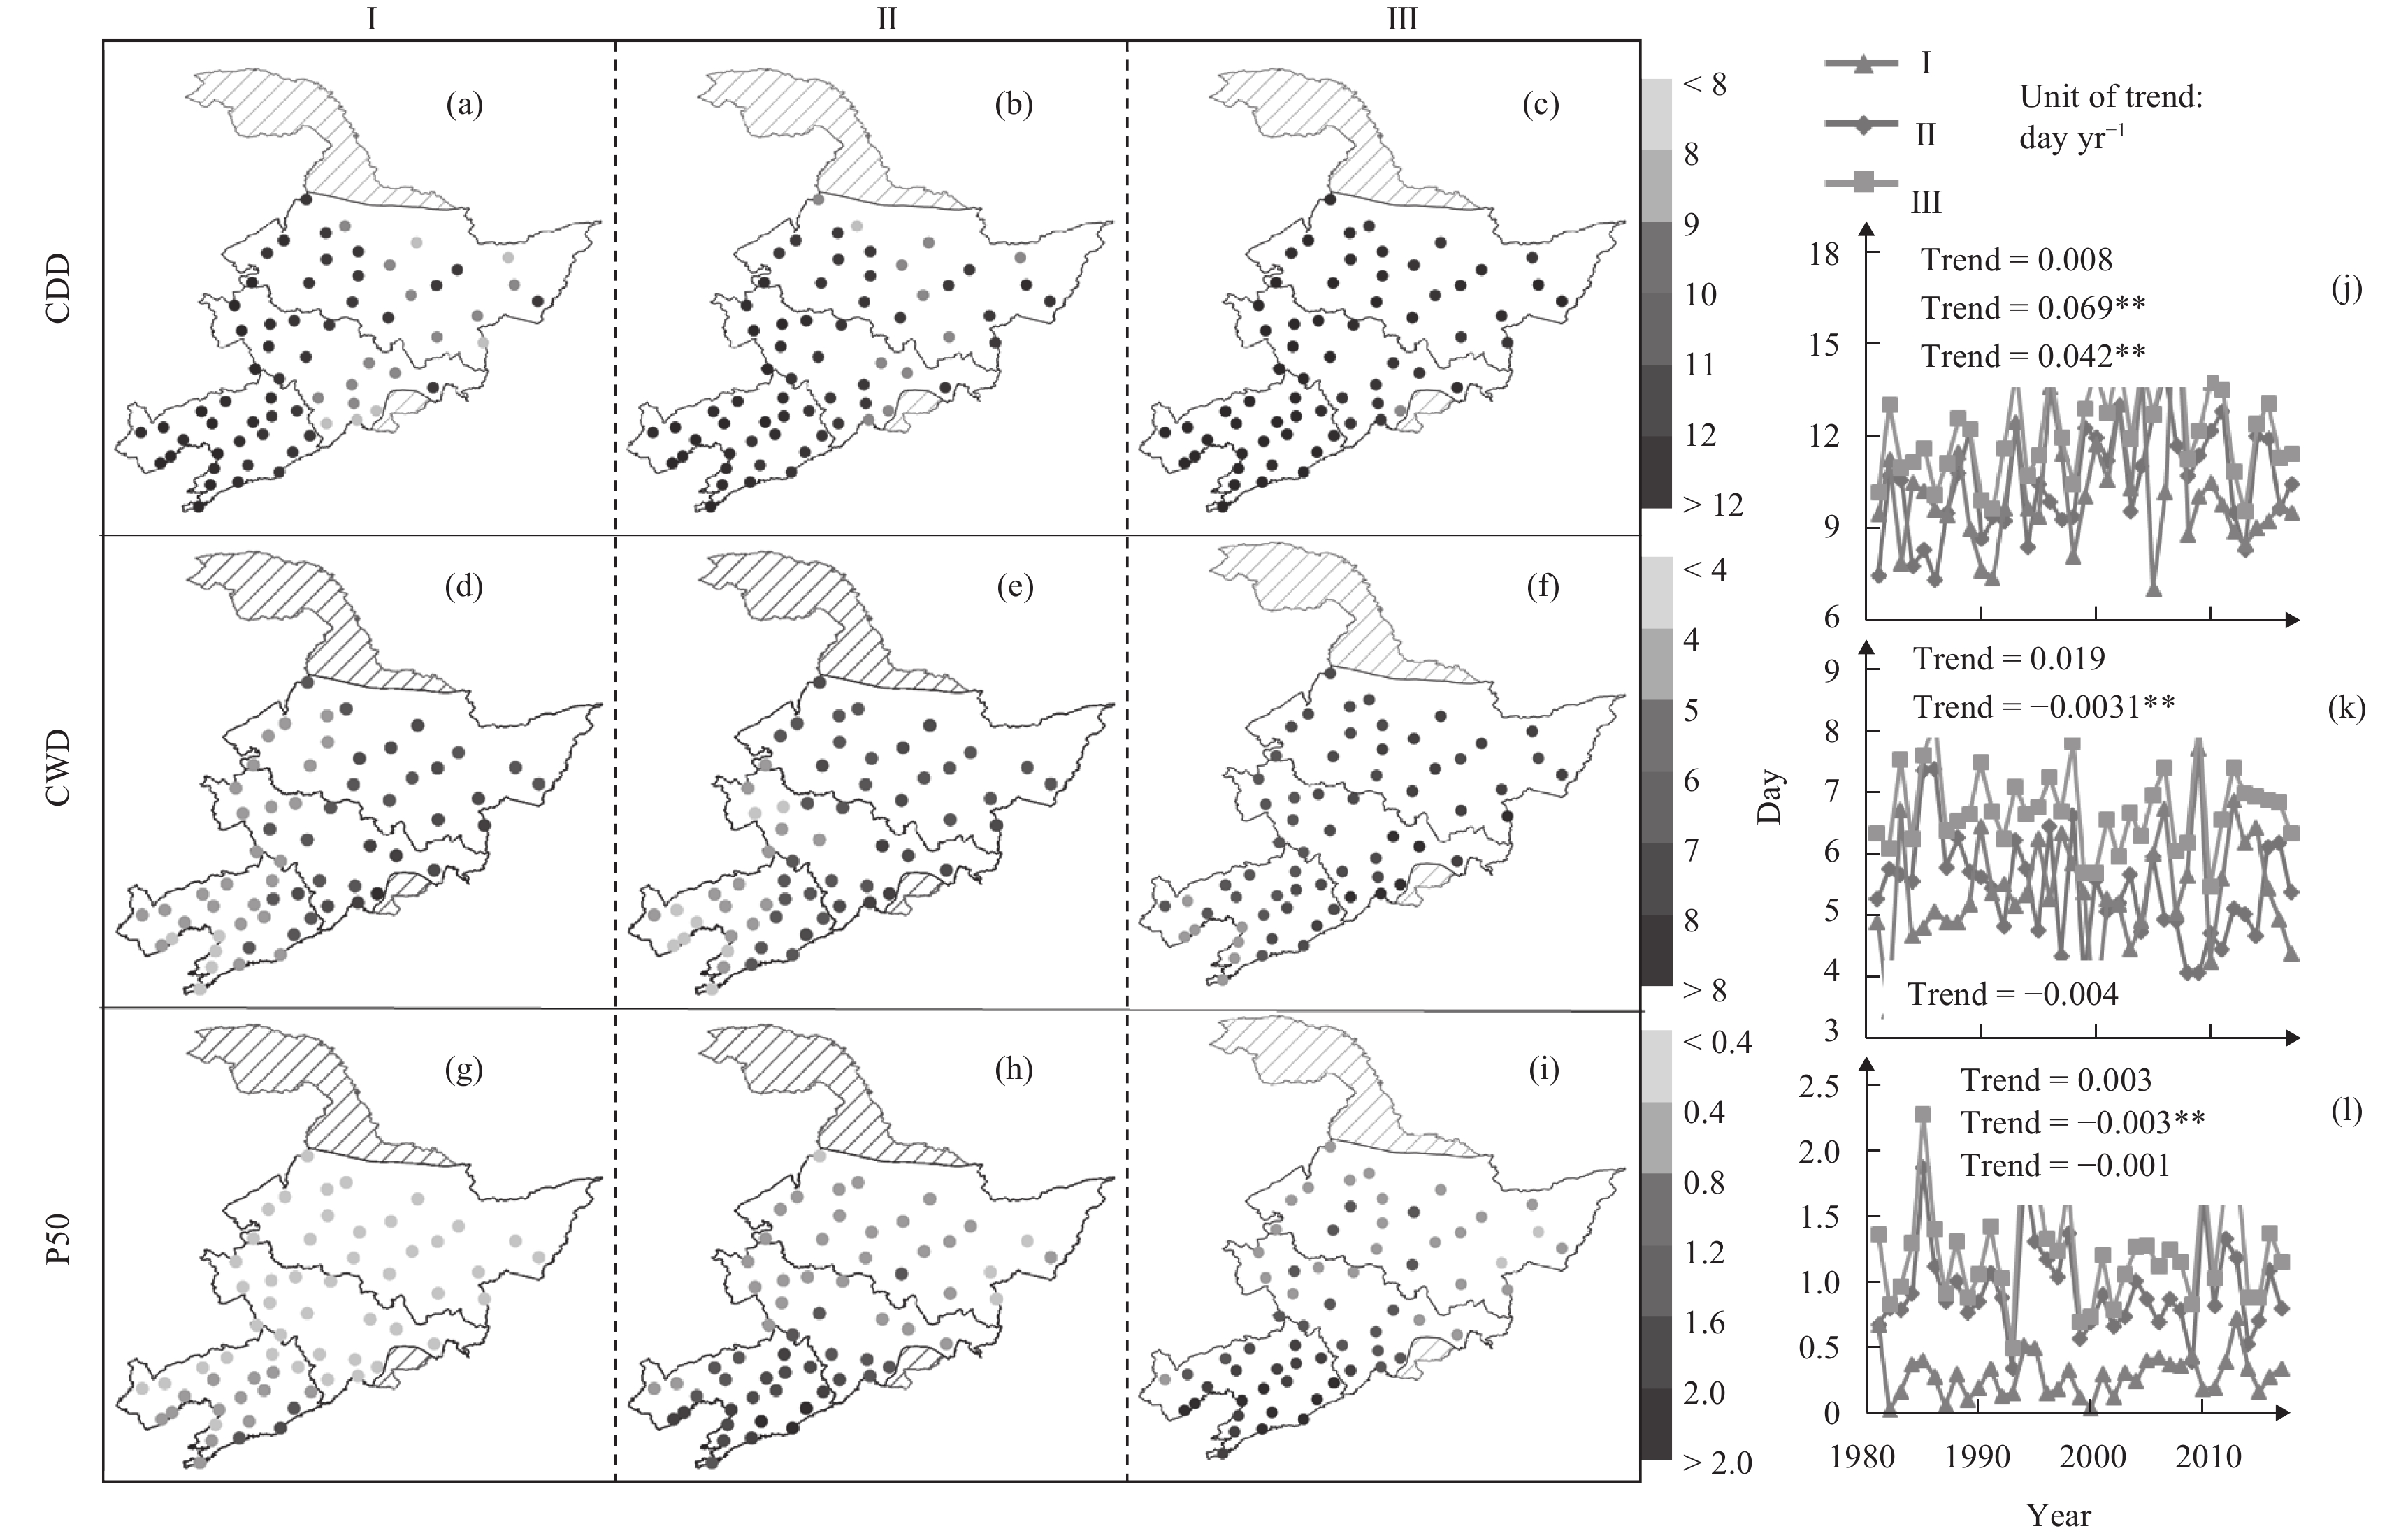
Precipitation is the only water supply source for the rain-fed soybean in NEC. From 1981 to 2017, CDD during the soybean growing season was 12.5 days. During the growing season, the average CDDs during the vegetative and reproductive stages were 10.2 and 10.5 days, respectively. Overall, the relatively high (low) numbers of CDD were focused in the southwestern (southeastern) part of NEC where AcEP was relatively small (large; Figs. 7a-c). During the study period, CDD during the soybean growing season significantly increased by 0.4 day decade–1 (p < 0.01). This was mainly due to the significant increase in CDD during the reproductive stage (0.7 day decade–1; p < 0.01).
Fig
7.
Geographical distributions of CDD (a–c), CWD (d–f), and P50 (g–i) during the (I) vegetative stage, (II) reproductive stage, and (III) soybean growing season from 1981 to 2017 for the station locations of this study. Time series of (j) CDD, (k) CWD, and (l) P50 during the vegetative stage (orange curves), reproductive stage (blue curves), and entire soybean growing season (grey curves) during the period of 1981–2017 for the station locations of this study. Linear annual trends in CDD, CWD, and P50 during the three study timescales are also listed in the time series plots. ** indicates that the coefficient of determination is statistically significant at p < 0.01.
In the sites that had low values of CDD, we further analyzed the spatial distribution and temporal trend of CWD. During the soybean growing season, the regional CWD was 6.5 days. During both the vegetative and reproductive stages, the regional average CWD was 5.3 days. The spatial distribution of CWD showed similar patterns to that of AcEP. The relatively low CWD values were concentrated in the southwestern part where AcEP was scarce, while the relatively high CWD values were concentrated in the southeastern part where AcEP was abundant (Figs. 7d-f). From 1981 to 2017, CWD increased during the vegetative stage (0.2 day decade–1). By contrast, CWD significantly decreased during the reproductive stage (0.3 day decade–1; p < 0.01). As a result, there was a slight decrease of CWD during the soybean growing season without significance (Fig. 7k).
Soybean plants are likely to suffer from waterlogging in heavy rains, when roots cannot respire due to the excessive water retention in the soil profile. From 1981 to 2017 in NEC, the P50 during the growing season was 1.2 days. Within the growing season, the regional average P50 was 0.3 (0.9) days during the vegetative (reproductive) stage. Overall, the P50 was relatively low in the northeastern and northwestern parts but relatively high in the southeastern part (Figs. 7g-i). Over the study period, the P50 slightly increased during the vegetative stage (nonsignificant) but slightly decreased during the reproductive stage (p < 0.01). During the soybean growing season, the P50 barely showed a linear trend (Fig. 7l).
4.
Discussion
In this study, we found a regional increase in GDD10 during the soybean growth season but a decrease in both AcEP and AcPAR during the soybean growing season. During the vegetative stage, there was an increase in both GDD10 and AcEP and a decrease in AcPAR. During the reproductive stage, GDD10, AcEP, and AcPAR all showed a decreasing trend. During the soybean growing season, the frequency of extreme heat days increased. During the four growth stages, the frequency of extreme cold days decreased. Overall, there was an increase in CDD but a decrease in CWD and P50 during the soybean growing season. These results are consistent with those reported in previous studies (Jiang et al., 2011; Xiao and Song, 2011; Wang et al., 2013; Zhao et al., 2013; Yin et al., 2016; Hu et al., 2017; Guo et al., 2019).
Available agro-climatic resources, including the thermal time, precipitation, and PAR, directly affect the growth, development, and yield formation of soybean (Trnka et al., 2011). From 1981 to 2017, GDD10 during the soybean growing season increased from northeast to southwest of NEC. During the growing season, GDD10 during the vegetative stage was lower than that during the reproductive stage. This could be explained by (a) the reproductive stage was longer than the vegetative stage; and (b) the reproductive stage (i.e., from July to September) was generally warmer than the vegetative stage (i.e., from May to June). We detected an increasing trend in GDD10 during the vegetative stage but a decreasing trend in GDD10 during the reproductive stage. These results are the opposite from a previous study (Yin et al., 2016), which was mainly caused by the different methods we used to compute GDD10. In addition, the reproductive stage for soybean was shortened by more than the vegetative stage in NEC (Fig. 2); air temperature rose faster in spring than that in summer and autumn in NEC (Piao et al., 2010). The within-season difference in GDD10 increasing trend gradually decreased from the southwestern to the northeastern part of NEC (Figs. 4, 5). It may be because GDD10 in the southwestern part was relatively high which would result in bigger shortening in the length of the soybean growing season, especially the length of the reproductive stage. The increase in GDD10 provides an opportunity for local farmers to plant cultivars that require a long growing season to achieve a high yield potential and make full use of the available heat resource (Zhao et al., 2014).
During 1981–2017, AcEP during the soybean growing season and the two growth stages increased from northwest to southeast in NEC. We found similar spatial distribution and temporal trend in AcEP within the soybean growing season to a previous related study (Yin et al., 2016). Because the reproductive stage coincided with the rainy season, AcEP during the reproductive stage was higher than that during the vegetative stage. AcEP during the soybean growing season and the reproductive stage showed a statistically significant decrease, while AcEP during the vegetative stage showed an increasing trend. This within-season difference in the AcEP trend arises from the following two reasons. (a) The length of the reproductive stage was shortened more than that of the vegetative stage; and (b) in NEC, precipitation slightly increased in spring (corresponding to the vegetative stage) but significantly decreased in summer and autumn (corresponding to part of the vegetative stage and entire reproductive stage) (Piao et al., 2010). In the southeastern part of NEC, the difference of within-season AcEP trend was relatively small (Figs. 4, 5). This could be explained by the fact that these locations are nearby ocean, which has provided a critical buffer to slow the effects of climate changes. Rainfed soybean is dominant in NEC (Zhu et al., 2019). The adverse effect of the decrease in AcEP during the soybean growing season, especially during the reproductive stage, could become considerable. We suggest that local soybean farmers could take the following preventive measures: choosing the drought-resistant varieties; adjusting the sowing date so the critical growth periods for water stress could be close to the rainy season; and supplementing proper irrigation as needed (Hao et al., 2016).
Within the soybean growing season, AcPAR was similar between the two growth stages; but AcPAR during the reproductive stage decreased faster than that during the vegetative stage. A previous study showed that the decreasing trend in Rs was smaller during the reproductive stage than that during the vegetative stage (Yin et al., 2016). Therefore, the difference in the AcPAR trend between the two growth stages was attributed to the different trends in the length of the growth stage rather than those in Rs. In the southwestern and northwestern parts of NEC, AcPAR during the growing season was relatively high and the within-season difference in AcPAR trend was relatively great (Figs. 3–5). We suggest that local soybean farmers in the west of NEC switch to cultivars that have high energy-use efficiency and adjust the planting density to combat the decreasing AcPAR during the soybean growing season (Hao et al., 2016; Zhao and Yang, 2018). We should comprehensively analyze the spatial distribution and temporal trend of GDD10, AcEP, and AcPAR in different sub-regions to propose different adaptation measures. Such as the southwestern part of NEC had relatively high GDD10 and AcPAR but low AcEP during the soybean growing season. We recommend local farmers to supplement irrigation, if available, especially during the water-sensitive critical growing stage, in order to improve the soybean yield in this area.
Climate changes also result in more frequent extreme climate events (Ho et al., 2018), which can cause serious damage to the crop growth and development as well as jeopardize crop yield formation (Lobell et al., 2013, 2015). In NEC, Tmin increased faster than Tmax (Piao et al., 2010). As a result, the frequency of extreme cold days decreased while the frequency of extreme heat days increased. In NEC, we found the relatively high frequency of extreme cold days in the northern part and relatively high frequency of extreme heat days in the southwestern part. These results are consistent with the previous related studies (Qin et al., 2012; Wang et al., 2013). Extreme heat can shorten the length of the soybean growth season, reduce the crop photosynthesis rate, and reduce dry matter accumulation (Ramteke et al., 2015). Extreme cold can delay seedling emergence, adversely affect the plant vegetative growth, increase the risk of chilling damage during the flowering phase, and reduce the grain filling rate (Sun and Huang, 2011). In order to minimize the potential adverse effects of extreme cold events on soybean production, especially in the northern part of NEC, we suggest that local soybean farmers should adjust sowing dates to avoid seedling injury and adopt cultivars that require less accumulated temperature or have shorter growing seasons to avoid the injury in the reproductive stage. As for avoiding the harm of extreme heat events, we suggest that local soybean farmers should adjust the sowing date for soybean or choose heat-resistant varieties, especially in the southeastern part of NEC.
In this study, CDD during the soybean growing season increased, imposing a high drought risk for soybean plants in the southwest of NEC where CDD was relatively high. CWD and P50 during the soybean growing season both showed a decreasing trend over the study period. This indicates that the soybean plants face a high risk of waterlogging and low PAR in the southeast of NEC where CWD and P50 were relatively large. These findings are consistent with other related studies (Khan et al., 2016; Guo et al., 2019). In NEC, precipitation increased in spring but decreased in summer and autumn, fluctuations of seasonal precipitation increased (Piao et al., 2010; Fu et al., 2013), and the increasing trend of CDD and decreasing trends of both CPD and P50 in the reproductive stage were larger than those in the vegetative stage. During the reproductive stage, the prolonged dry episodes impose a high risk of crop drought that ultimately threatens the soybean yield. Hence, we suggest that local farmers, especially the farmers in the western part of NEC, where CDD is relatively high, take preventive measures (such as applying proper irrigation and adjusting sowing dates, etc.) to partially offset the potential adverse effect of increasing CDD on soybean production. In the southeastern part of NEC, the numbers of CWD and P50 were both relatively high. This indicates that soybean plants are more likely to suffer from waterlogging and have a lower rainfall-use efficiency. Therefore, we suggest that local farmers should take measures of field drainage and choose cultivars that have high tolerance to waterlogging for the sake of alleviating the adverse effect that the excessive water retention in the soil profile has on soybean plants.
The goal of our work is to provide scientific evidence to guide local soybean farmers in choosing suitable cultivars, adjusting sowing dates, and so on, but there are some limitations of this study. We simply replaced the missing phenological records with those in adjacent years, which may not be representative of the actual phenological events. We derived the phenological data for weather stations from the interpolated regional map without considering the effects of altitudes on phenological events. This method causes some errors, but the effects may be trivial because of the small number of the differences of altitudes. Extreme wind events are also an important aspect of extreme climate events which affect the soybean growth. In future research, we need to pay more attention to the impact of extreme wind events. Future studies should focus on the following aspects in order to increase soybean yield: (a) use actual crop data that are collected at or in the vicinity of the weather station; (b) include the analysis of indices for extreme wind events; and (c) quantify the impacts of historical changes in agro-climatic resources and extreme weather events on the soybean yield.
5.
Conclusions
In NEC, it is important for soybean farmers to understand the spatiotemporal characteristics of the growing season climate in order to decide the proper planting time, optimal cultivars, necessity of irrigation applications, and so on. In this study, we investigated both the average agro-climatic environment and extreme climate events that affect soybean production in NEC. During 1981–2017, GDD10 during the soybean growing season and vegetative stage both showed an increasing trend. By contrast, GDD10 during the reproductive stage showed a decreasing trend. This within-growing-season asymmetry in the GDD10 trend was more pronounced in the southwestern part of the study region than that in the northeastern part. AcEP decreased during the soybean growing season and reproductive stage, and increased slightly in the vegetative stage. The within-growing season asymmetry in the AcEP trend was more prominent in the east (especially the northeastern part) of NEC than that in the rest of the region. AcPAR decreased during the soybean growing season, vegetative stage, and reproductive stage; and the decreasing trend in the reproductive stage was larger than that in the vegetative stage. This within-growing season difference in the AcPAR decreasing trend was relatively large in the south of NEC. During the soybean growing season, the frequency of extreme heat days showed a significant increasing trend, and the relatively higher values were focused in the southeastern part of NEC. During the flowering phase and beginning pod to full maturity, the frequency of extreme cold days was high and showed a significant decreasing trend. The higher value area of the frequency of extreme cold days was in the north of NEC. The number of CDD increased in the soybean growing season, and the higher value area was focused in the southwestern part of NEC, which indicates a relatively high risk of waterlogging droughts. The numbers of CWD and P50 during the soybean growing season both showed a decreasing trend over the study period, and were relatively high in the southeastern part of NEC, which indicates a relatively high risk of waterlogging and relatively low levels of PAR. The results of our study could be used to assist in taking appropriate measures, including switching cultivars, adjusting sowing date, supplementing irrigation, and so on, to adjust to the changing climate in different parts of NEC.
Fig.
4.
Temporal trends in (a) GDD10, (b) AcEP, and (c) AcPAR during the vegetative stage, reproductive stage, and entire growing season from 1981 to 2017 for the 64 surface observing stations (listed in latitude order on the y-axis) in NEC.
Fig.
2.
Time series of soybean phenology from 1992 to 2013 for the 33 agro-meteorological stations in NEC. (a) Sowing date, (b) emergence date, (c) flowering date, (d) beginning pod date, and (e) maturity date.
Fig.
3.
Geographical distributions of GDD10, AcEP, and AcPAR during the vegetative stage, reproduction stage, and entire growing season for soybean from 1981 to 2017 in NEC.
Fig.
5.
Temporal trends in (a) GDD10, (b) AcEP, and (c) AcPAR during the vegetative stage, reproductive stage, and entire growing season from 1981 to 2017 for the 64 surface observing stations (listed in longitude order on the x-axis) in NEC.
Fig.
6.
Geographical distributions of (a) Tmax, (b) Tmin, (c) DTR, (d) EC6, (e) EC10, (f) EC17, (g) EC15, and (h) EH30 during the soybean growing season and two growth stages from 1981 to 2017 in NEC. Temporal trends in (h) Tmax, (i) Tmin, (k) DTR, (l) EC6, (m) EC10, (n) EC17, (o) EC15, and (p) EH30 during the soybean growing season and two growth stages from 1981 to 2017 in NEC. ** indicates that the coefficient of determination is statistically significant at p < 0.01.
Fig.
7.
Geographical distributions of CDD (a–c), CWD (d–f), and P50 (g–i) during the (I) vegetative stage, (II) reproductive stage, and (III) soybean growing season from 1981 to 2017 for the station locations of this study. Time series of (j) CDD, (k) CWD, and (l) P50 during the vegetative stage (orange curves), reproductive stage (blue curves), and entire soybean growing season (grey curves) during the period of 1981–2017 for the station locations of this study. Linear annual trends in CDD, CWD, and P50 during the three study timescales are also listed in the time series plots. ** indicates that the coefficient of determination is statistically significant at p < 0.01.
Allen, R. G., L. S. Pereira, D. Raes, et al., 1998: Crop Evapotranspiration-Guidelines for Computing Crop Water Requirements. FAO Irrigation and Drainage Paper 56, FAO, Rome, 15 pp. [Avaiblable online at http://www.fao.org/3/X0490E/X0490E00.htm. Accessed on 03 November 2020.]
Bellon, M. R., D. Hodson, and J. Hellin, 2011: Assessing the vulnerability of traditional maize seed systems in Mexico to climate change. Proc. Natl. Acad. Sci. USA, 108, 13,432–13,437. doi: 10.1073/pnas.1103373108
Chen, X. X., L. C. Wang, Z. G. Niu, et al., 2020: The effects of projected climate change and extreme climate on maize and rice in the Yangtze River Basin, China. Agric. Forest Meteor., 282–283, 107867. doi: 10.1016/j.agrformet.2019.107867
Chu, Z., J. P. Guo, and J. F. Zhao, 2017: Impacts of future climate change on agroclimatic resources in Northeast China. J. Geogr. Sci., 27, 1044–1058. doi: 10.1007/s11442-017-1420-6
Döll, P., and S. Siebert, 2002: Global modeling of irrigation water requirements. Water Resour. Res., 38, 1037. doi: 10.1029/2001wr000355
Fang, J. Y., G. R. Yu, L. L. Liu, et al., 2018: Climate change, human impacts, and carbon sequestration in China. Proc. Natl. Acad. Sci. USA, 115, 4015–4020. doi: 10.1073/pnas.1700304115
Ferreira, D. B., and V. B. Rao, 2011: Recent climate variability and its impacts on soybean yields in southern Brazil. Theor. Appl. Climatol., 105, 83–97. doi: 10.1007/s00704-010-0358-8
Fu, G. B., J. J. Yu, X. B. Yu, et al., 2013: Temporal variation of extreme rainfall events in China, 1961–2009. J. Hydrol., 487, 48–59. doi: 10.1016/j.jhydrol.2013.02.021
Grimm, S. S., J. W. Jones, K. J. Boote, et al., 1993: Parameter estimation for predicting flowering date of soybean cultivars. Crop Sci., 33, 137–144. doi: 10.2135/cropsci1993.0011183X003300010025x
Grimm, S. S., J. W. Jones, K. J. Boote, et al., 1994: Modeling the occurrence of reproductive stages after flowering for four soybean cultivars. Agron. J., 86, 31–38. doi: 10.2134/agronj1994.00021962008600010007x
Guo, E. L., J. Q. Zhang, Y. F. Wang, et al., 2019: Spatiotemporal variations of extreme climate events in Northeast China during 1960–2014. Ecol. Indicators, 96, 669–683. doi: 10.1016/j.ecolind.2018.09.034
Hao, B., Q. Xue, T. H. Marek, et al., 2016: Radiation-use efficiency, biomass production, and grain yield in two maize hybrids differing in drought tolerance. J. Agron. Crop Sci., 202, 269–280. doi: 10.1111/jac.12154
He, L., N. Jin, and Q. Yu, 2020: Impacts of climate change and crop management practices on soybean phenology changes in China. Sci. Total Environ., 707, 135638. doi: 10.1016/j.scitotenv.2019.135638
He, X. L., 2016: Effects of short-term high temperature on flowering and setting pod progression, yield of soybean. Master dissertation, Nanjing Agriculture University, Nanjing, 69 pp. (in Chinese)
Ho, C. H., H. S. Lur, M. H. Yao, et al., 2018: The impact on food security and future adaptation under climate variation: A case study of Taiwan’s agriculture and fisheries. Mitig. Adapt. Strateg. Glob. Change, 23, 311–347. doi: 10.1007/s11027-017-9742-3
Hu, H. J., M. Wang, X. G. Yin, et al., 2017: Spatial and temporal changes of soybean water requirement under climate changes in the Northeast Farming Region of China. J. China Agric. Univ., 22, 21–31. (in Chinese)
Hu, Q., F. F. Pan, X. B. Pan, et al., 2016: Trends in agricultural heat and solar radiation resources in Northeast China: A multistage spatio–temporal analysis. Int. J. Climatol., 36, 2461–2468. doi: 10.1002/joc.4505
IPCC, 2014: Climate Change 2014: Impacts, Adaptation, and Vulnerability. Cambridge University Press, Cambridge, 207 pp.
Jiang, L. X., S. Li, X. F. Li, et al., 2011: Impacts of climate change on development and yield of soybean over past 30 years in Heilongjiang Province. Soybean Sci., 30, 921–926. (in Chinese)
Khan, M. I., D. Liu, Q. Fu, et al., 2016: Precipitation variability assessment of Northeast China: Songhua River basin. J. Earth Syst. Sci., 125, 957–968. doi: 10.1007/s12040-016-0715-9
Li, K. N., X. G. Yang, Z. J. Liu, et al., 2014: Low yield gap of winter wheat in the North China Plain. Eur. J. Agron., 59, 1–12. doi: 10.1016/j.eja.2014.04.007
Li, Y. J., R. Z. Chang, Y. T. Zhao, et al., 1989: Studies on tolerance to cold in soybean II. Effect of low temperature treatment during germination on growth and development. Soybean Sci., 4, 41–43. (in Chinese)
Liu, X. B., J. Jin, G. H. Wang, et al., 2008: Soybean yield physiology and development of high-yielding practices in Northeast China. Field Crops Res., 105, 157–171. doi: 10.1016/j.fcr.2007.09.003
Liu, Z. J., X. G. Yang, W. F. Wang, et al., 2009: Characteristics of agricultural climate resources in three provinces of Northeast China under global climate change. Chinese J. Appl. Ecol., 20, 2199–2206. (in Chinese)
Lizaso, J. I., W. D. Batchelor, M. E. Westgate, et al., 2003: Enhancing the ability of CERES-Maize to compute light capture. Agric. Syst., 76, 293–311. doi: 10.1016/S0308-521X(02)00003-3
Lobell, D. B., G. L. Hammer, G. McLean, et al., 2013: The critical role of extreme heat for maize production in the United States. Nat. Climate Change, 3, 497–501. doi: 10.1038/nclimate1832
Lobell, D. B., G. L. Hammer, K. Chenu, et al., 2015: The shifting influence of drought and heat stress for crops in Northeast Australia. Global Change Biol., 21, 4115–4127. doi: 10.1111/gcb.13022
Mall, R. K., M. Lal, V. S. Bhatia, et al., 2004: Mitigating climate change impact on soybean productivity in India: A simulation study. Agric. Forest Meteor., 121, 113–125. doi: 10.1016/S0168-1923(03)00157-6
Piao, S. L., P. Ciais, Y. Huang, et al., 2010: The impacts of climate change on water resources and agriculture in China. Nature, 467, 43–51. doi: 10.1038/nature09364
Qin, Y. L., Z. B. Sun, and D. H. Ni, 2012: Variation features of summer extreme high temperature over Northeast China and its relations with atmospheric circulation anomaly. Meteor. Disaster Reduct. Res., 35, 7–16. (in Chinese) doi: 10.3969/j.issn.1007-9033.2012.02.002
Qin, Y. W., J. Y. Liu, W. J. Shi, et al., 2013: Spatial–temporal changes of cropland and climate potential productivity in northern China during 1990–2010. Food Secur., 5, 499–512. doi: 10.1007/s12571-013-0280-x
Ramteke, R., G. K. Gupta, and D. V. Singh, 2015: Growth and yield responses of soybean to climate change. Agric. Res., 4, 319–323. doi: 10.1007/s40003-015-0167-5
Rose, G., T. Osborne, H. Greatrex, et al., 2016: Impact of progressive global warming on the global-scale yield of maize and soybean. Climatic Change, 134, 417–428. doi: 10.1007/s10584-016-1601-9
Shi, P. J., S. Sun, and M. Wang, 2014: Climate change regionalization in China (1961–2010). Sci. China Earth Sci., 57, 2676–2689. doi: 10.1007/s11430-014-4889-1
Southworth, J., R. A. Pfeifer, M. Habeck, et al., 2002: Changes in soybean yields in the midwestern United States as a result of future changes in climate, climate variability, and CO2 fertilization. Climatic Change, 53, 447–475. doi: 10.1023/A:1015266425630
Sun, S., X. G. Yang, X. M. Lin, et al., 2018: Winter wheat yield gaps and patterns in China. Agron. J., 110, 319–330. doi: 10.2134/agronj2017.07.0417
Sun, W., and Y. Huang, 2011: Global warming over the period 1961–2008 did not increase high-temperature stress but did reduce low-temperature stress in irrigated rice across China. Agric. Forest Meteor., 151, 1193–1201. doi: 10.1016/j.agrformet.2011.04.009
Trnka, M., J. E. Olesen, K. C. Kersebaum, et al., 2011: Agroclimatic conditions in Europe under climate change. Global Change Biol., 17, 2298–2318. doi: 10.1111/j.1365-2486.2011.02396.x
Wang, B. L., M. J. Zhang, J. L. Wei, et al., 2013: Changes in extreme precipitation over Northeast China, 1960–2011. Quat. Int., 298, 177–186. doi: 10.1016/j.quaint.2013.01.025
Wang, X. Y., X. G. Yang, S. Sun, et al., 2015: Comparison of potential yield and resource utilization efficiency of main food crops in three provinces of Northeast China under climate change. Chinese J. Appl. Ecol., 26, 3091–3120. (in Chinese) doi: 10.13287/j.1001-9332.20150921.028
Wang, X. Y., T. Li, X. G. Yang, et al., 2018: Rice yield potential, gaps and constraints during the past three decades in a climate-changing Northeast China. Agric. Forest Meteor., 259, 173–183. doi: 10.1016/j.agrformet.2018.04.023
Wei, P. M., 2019: Status and countermeasures of China’s soybean export trade under the background of international soybean supply and demand. Pract. Foreign Econ. Relat. Trade, 9, 45–49. (in Chinese)
Xiao, F. J., and L. C. Song, 2011: Analysis of extreme low-temperature events during the warm season in Northeast China. Nat. Hazards, 58, 1333–1344. doi: 10.1007/s11069-011-9735-6
Yin, X. G., J. E. Olesen, M. Wang, et al., 2016: Climate effects on crop yields in the Northeast Farming Region of China during 1961–2010. J. Agric. Sci., 154, 1190–1208. doi: 10.1017/S0021859616000149
Zhang, D. R., and X. J. Zhang, 1988: Study on cool injury of soybean. Soybean Sci., 7, 125–132. (in Chinese) doi: 10.11861/j.issn.1000-9841.1988.02.0125
Zhang, Z., X. Song, F. L. Tao, et al., 2016: Climate trends and crop production in China at county scale, 1980 to 2008. Theor. Appl. Climatol., 123, 291–302. doi: 10.1007/s00704-014-1343-4
Zhang, Z. T., X. G. Yang, Z. J. Liu, et al., 2020: Spatio–temporal characteristics of agro-climatic indices and extreme weather events during the growing season for summer maize (Zea mays L.) in Huanghuaihai region, China. Int. J. Biometeor., 64, 827–839. doi: 10.1007/s00484-020-01872-6
Zhao, C. Y., Y. Wang, X. Y. Zhou, et al., 2013: Changes in clima-tic factors and extreme climate events in Northeast China during 1961–2010. Adv. Climate Change Res., 4, 92–102. doi: 10.3724/SP.J.1248.2013.092
Zhao, J., and X. G. Yang, 2018: Average amount and stability of available agro-climate resources in the main maize cropping regions in China during 1981–2010. J. Meteor. Res., 32, 146–156. doi: 10.1007/s13351-018-7122-x
Zhao, J., X. G. Yang, S. Lv, et al., 2014: Variability of available climate resources and disaster risks for different maturity types of spring maize in Northeast China. Reg. Environ. Change, 14, 17–26. doi: 10.1007/s10113-013-0476-9
Zhu, B. W., X. H. Xie, S. S. Meng, et al., 2020: Sensitivity of soil moisture to precipitation and temperature over China: Present state and future projection. Sci. Total Environ., 705, 135774. doi: 10.1016/j.scitotenv.2019.135774
Zhu, X., T. J. Troy, and N. Devineni, 2019: Stochastically modeling the projected impacts of climate change on rainfed and irrigated US crop yields. Environ. Res. Lett., 14, 074021. doi: 10.1088/1748-9326/ab25a1
Shayan Khan Kakar, Jing Wang, Noman Arshed, et al. The impact of circular economy, sustainable infrastructure, and green FinTech on biodiversity in Europe: A holistic approach. Technology in Society, 2025, 81: 102841.
DOI:10.1016/j.techsoc.2025.102841
2.
Rui Li, Cuiying Zhang, Jianping Guo, et al. Maize grain filling characteristics in China: Response to meteorological factors. Heliyon, 2024, 10(9): e30791.
DOI:10.1016/j.heliyon.2024.e30791
3.
Hengfei Zhang, Xinglong Mu, Fanxiang Meng, et al. Future Increase in Extreme Precipitation: Historical Data Analysis and Influential Factors. Sustainability, 2024, 16(22): 9887.
DOI:10.3390/su16229887
4.
Jun Sun, Wenquan Niu, Fei Mu, et al. Optimized tillage can enhance crop tolerance to extreme weather events: Evidence from field experiments and meta-analysis. Soil and Tillage Research, 2024, 238: 106003.
DOI:10.1016/j.still.2024.106003
5.
Meirong Li, Yuefeng Liu, Yuying Pan, et al. Quantifying High-Temperature and Drought Stress Effects on Soybean Growth and Yield in the Western Guanzhong Plain. Atmosphere, 2024, 15(4): 392.
DOI:10.3390/atmos15040392
6.
Jun Sun, Wenquan Niu, Yadan Du, et al. Combined tillage: A management strategy to improve rainfed maize tolerance to extreme events in northwestern China. Agricultural Water Management, 2023, 289: 108503.
DOI:10.1016/j.agwat.2023.108503
7.
Shibo Guo, Zhentao Zhang, Fangliang Zhang, et al. Optimizing cultivars and agricultural management practices can enhance soybean yield in Northeast China. Science of The Total Environment, 2023, 857: 159456.
DOI:10.1016/j.scitotenv.2022.159456
8.
Fanxiang Meng, Zhimin Sun, Fangli Dong, et al. Spatiotemporal Evolution of Precipitation Heterogeneity Characteristics in the Heilongjiang Province from 1961 to 2020. Agronomy, 2023, 13(12): 3057.
DOI:10.3390/agronomy13123057
9.
Minghua Xin, Zhenggui Zhang, Yingchun Han, et al. Soybean phenological changes in response to climate warming in three northeastern provinces of China. Field Crops Research, 2023, 302: 109082.
DOI:10.1016/j.fcr.2023.109082
10.
Luanxuan Zhu, Xiaodong Yan. Change and attribution of frost days and frost‐free periods in China. International Journal of Climatology, 2023, 43(16): 7935.
DOI:10.1002/joc.8310
11.
Yuanling Zhang, Shu Kee Lam, Ping Li, et al. Early–maturing cultivar of winter wheat is more adaptable to elevated [CO2] and rising temperature in the eastern Loess Plateau. Agricultural and Forest Meteorology, 2023, 332: 109356.
DOI:10.1016/j.agrformet.2023.109356
12.
Qian-chuan LI, Shi-wei XU, Jia-yu ZHUANG, et al. Ensemble learning prediction of soybean yields in China based on meteorological data. Journal of Integrative Agriculture, 2023, 22(6): 1909.
DOI:10.1016/j.jia.2023.02.011
13.
Shibo Guo, Erjing Guo, Zhentao Zhang, et al. Impacts of mean climate and extreme climate indices on soybean yield and yield components in Northeast China. Science of The Total Environment, 2022, 838: 156284.
DOI:10.1016/j.scitotenv.2022.156284
Other cited types(0)
Search
Citation
Guo, S. B., X. G. Yang, Z. T. Zhang, et al., 2020: Spatial distribution and temporal trend characteristics of agro-climatic resources and extreme climate events during the soybean growing season in Northeast China from 1981 to 2017. J. Meteor. Res., 34(6), 1309–1323, doi: 10.1007/s13351-020-0061-3.
Guo, S. B., X. G. Yang, Z. T. Zhang, et al., 2020: Spatial distribution and temporal trend characteristics of agro-climatic resources and extreme climate events during the soybean growing season in Northeast China from 1981 to 2017. J. Meteor. Res., 34(6), 1309–1323, doi: 10.1007/s13351-020-0061-3.
Guo, S. B., X. G. Yang, Z. T. Zhang, et al., 2020: Spatial distribution and temporal trend characteristics of agro-climatic resources and extreme climate events during the soybean growing season in Northeast China from 1981 to 2017. J. Meteor. Res., 34(6), 1309–1323, doi: 10.1007/s13351-020-0061-3.
Citation:
Guo, S. B., X. G. Yang, Z. T. Zhang, et al., 2020: Spatial distribution and temporal trend characteristics of agro-climatic resources and extreme climate events during the soybean growing season in Northeast China from 1981 to 2017. J. Meteor. Res., 34(6), 1309–1323, doi: 10.1007/s13351-020-0061-3.
Export: BibTexEndNote
Article Metrics
Article views: 588 PDF downloads: 60Cited by: 13
Manuscript History
Received: 06 April 2020
Available online: 18 July 2020
Final form: 03 July 2020
Issue in Progress: 29 October 2020
Published online: 25 December 2020
Share
Catalog
Abstract
1.
Introduction
2.
Materials and methods
2.1
Study area and data
2.2
Agro-climatic resources
2.3
Extreme climate events
2.4
Methods
3.
Results
3.1
Changes in soybean phenology
3.2
Spatial distributions and temporal trends of agro-climatic resources


 DownLoad: