Nanjing Innovation Institute for Atmospheric Sciences, Chinese Academy of Meteorological Sciences–Jiangsu Meteorological Service, Nanjing 210041
2.
State Key Laboratory of Severe Weather, Chinese Academy of Meteorological Sciences, Beijing 100081
3.
Jiangsu Key Laboratory of Severe Storm Disaster Risk/Key Laboratory of Transportation Meteorology of Chinese Academy of Meteorological Sciences, Nanjing 210041
4.
Unit 93307, People’s Liberation Army, Shenyang 110000
Supported by the National Natural Science Foundation of China (42305177 and 42175006), Beijige Foundation (BJG202210), and Open Research Program of the State Key Laboratory of Severe Weather (2023LASW-B16).
The Advanced Geosynchronous Radiation Imager (AGRI) onboard China’s Fengyun (FY)-4 satellites, which provides observational data across various wavelengths from visible to infrared (IR), holds great potential for diverse applications. However, the FY-4A AGRI mid-wave IR (MWIR) band (3.75 µm) is often contaminated by stray light in the midnight hours during the 1–2 months before and after the vernal or autumnal equinoxes. In this study, a U-Net-based deep learning model was employed to generate an expedient MWIR band from the FY-4A AGRI longwave IR band. Validation using normal radiance measurements revealed that MWIR brightness temperatures generated by the deep learning model are very close to those observed by the FY-4A AGRI, with mean absolute error of 1.48 K, root mean square error of 2.39 K, and a correlation coefficient of 0.99. When applying the model to periods of stray light contamination, the brightness temperature anomalies found in the FY-4A AGRI MWIR band are effectively eliminated. The findings of this study could support various scientific applications that necessitate use of the MWIR band during midnight hours, such as identification of fog/low stratus cloud.
As the second generation of China’s geostationary meteorological satellites, the Fengyun (FY)-4 series satellites exhibit enhanced capability and efficiency through increased spatiotemporal and spectral resolutions, and advanced imaging registration and navigation techniques, compared with the satellites of the earlier FY-2 series (Zhang et al., 2019). The primary imager instrument onboard the FY-4 satellites is the Advanced Geosynchronous Radiation Imager (AGRI), which pro-vides observational data across various wavelengths from visible to infrared (IR). The AGRI bears similarities to the Advanced Himawari Imager (AHI) onboard Japan’s Himawari-8/9 geostationary meteorological satellites (Bessho et al., 2016), the Advanced Baseline Imager onboard the U.S. Geostationary Operational Environmental Satellite series (Schmit et al., 2018), and the Advanced Meteorological Imager (AMI) onboard the Geostationary Korea Multi-Purpose Satellite-2A (GK-2A) (Oh et al., 2019). AGRI observations are used widely for various purposes in meteorological and environmental fields, including atmospheric and surface parameter retrievals (Min et al., 2020; Dong et al., 2023; Meng et al., 2024), meteorological disaster monitoring (Shao et al., 2020; Wu et al., 2022), and numerical weather prediction (Shu et al., 2023; Xu et al., 2023).
Recent studies demonstrated that the observational biases of the FY-4A and FY-4B AGRIs in the IR band are within a reasonable range (Zhu et al., 2020; Zhu Z. et al., 2023; Niu et al., 2023; Xie et al., 2023). However, Tang et al. (2021) reported that the FY-4A AGRI mid-wave IR (MWIR) band (3.75 µm) sometimes displays brightness temperature (BT) anomalies during the midnight hours (i.e., 1600–1800 UTC). These BT anomalies have obvious seasonal dependency, consistently occurring during the 1–2 months before and after the vernal or autumnal equinoxes. Under normal circumstances, the MWIR BTs at night are generally < 300 K. In contrast, when the anomalies occur, the MWIR BTs often surpass normal values by 10–20 K. The cause of BT anomalies in the AGRI MWIR band is stray light contamination, as identified by Tang et al. (2021), which is a problem that has also been found in relation to the Visible IR Spin-Scan Radiometer onboard the FY-2 series satellites (Guo et al., 2005; Hu et al., 2013). The MWIR band measures radiant energy from the atmosphere and the earth, as well as reflected energy from the sun. However, the contribution of the reflected solar component can be disregarded at night. Consequently, the MWIR band has an overall colder BT during nighttime compared with that during daytime. If the optical system is contaminated by direct or diffuse solar radiation (i.e., stray light) during nighttime, it can lead to anomalous increase in MWIR BT measurements.
Owing to the nonnegligible stray light contamination, observations using the FY-4B AGRI are now suspended around midnight for a total of 120 days around the spring and autumn equinoxes. However, MWIR band data are highly valuable and essential for various scientific applications. For example, fog and low stratus clouds exhibit much lower emissivity at the MWIR wavelength compared with that at the longwave IR (LWIR) wav-elength, a characteristic that aids detection of such phenomena at night (Lee et al., 1997; Zhuge and Zou, 2016). The MWIR band also differs from the LWIR band owing to its intense response to subpixel heat sources, which is advantageous for early detection of wildfires, especially in forested areas where fires burn hot (Weaver et al., 2004). The MWIR band is also useful for identification of cirrus, and broken and overlapping clouds (Baum et al., 2003; Zhuge and Zou, 2016). Thus, it is crucial to consider how to obtain reliable AGRI MWIR measurements during periods of stray light contamination.
Previous studies employed various methods to correct the anomalies of MWIR measurements for the FY-2 Visible IR Spin-Scan Radiometer, encompassing both hardware (You et al., 2006; Shen et al., 2013) and software (Guo et al., 2005; Hu et al., 2013) solutions. However, FY-2 and FY-4 imagers differ in terms of their spectral, spatial, and temporal resolutions, and in relation to the intensity and spatial pattern of stray light contamination. Therefore, existing methods for correcting MWIR anomalies for the FY-2 Visible IR Spin-scan Radiometer cannot be applied directly to the FY-4 AGRI. With the advancement of artificial intelligence (AI), numerous studies have demonstrated that deep learning methods can automatically learn suitable characteristics from datasets, and capture statistical relationships between input variables and targets (Wang et al., 2022; Zhou et al., 2022). Deep learning methods have been applied successfully in the field of meteorology (Kim et al., 2019; Ebert-Uphoff and Hilburn, 2020; Zhang et al., 2021). Notably, U-Net models (Ronneberger et al., 2015) have gained attention for their simplicity, efficiency, ease of understanding, and suitability for customization (Han et al., 2022). They can fuse features of different scales (Li et al., 2019), thereby effectively enhancing model precision. Therefore, the U-Net structure or U-Net-based models are widely employed in satellite remote sensing tasks that include cloud property retrievals (Zhao et al., 2023), satellite imagery generation (Cheng et al., 2022; Yao et al., 2024), and radar composite reflectivity factor estimations (Sun et al., 2021). Consequently, the U-Net algorithm holds promise for obtaining measurements in the AGRI MWIR band.
The primary goal of this study was to develop a model for generating an expedient MWIR band for the AGRI during periods of stray light contamination. A U-Net-based model was constructed for the FY-4A AGRI instrument, and its performance and effectiveness were assessed comprehensively. The findings of this study will be useful for an expanded range of meteorological applications that necessitate use of MWIR band data.
2.
Data and method
2.1
FY-4A AGRI data
The FY-4A satellite was launched successfully in December 2016, and it commenced operation in September 2017 with sub-satellite longitude of 104.7°E and 86.5°E before and after March 2024, respectively. The FY-4A AGRI operates across a total of 14 bands spanning from visible (0.45 µm) to IR (13.8 µm) wav-elengths. It provides full-disk observation at 15-min intervals. The characteristics of the FY-4A MWIR and LWIR bands are listed in Table 1. The anomalies in the FY-4A AGRI MWIR band occur at 1600–1800 UTC before and after the vernal or autumnal equinoxes (Tang et al., 2021). Anomalies at 1700 UTC start from early February and early August, and end in mid-May and mid-November, whereas anomalies at 1600 and 1800 UTC typically start later in the year and end earlier in the year than those at 1700 UTC.
Table
1.
Characteristics of the FY-4A AGRI, GK-2A AMI, and Himawari-8 AHI bands used in this study (FWHM: full width at half maximum, NEΔT: noise-equivalent differential temperature). Detailed information can be found at https://space.oscar.wmo.int/
Note: FWHM: full width at half maximum and NEΔT: noise-equivalent differential temperature. Detailed information can be found at https://space.oscar.wmo.int/.
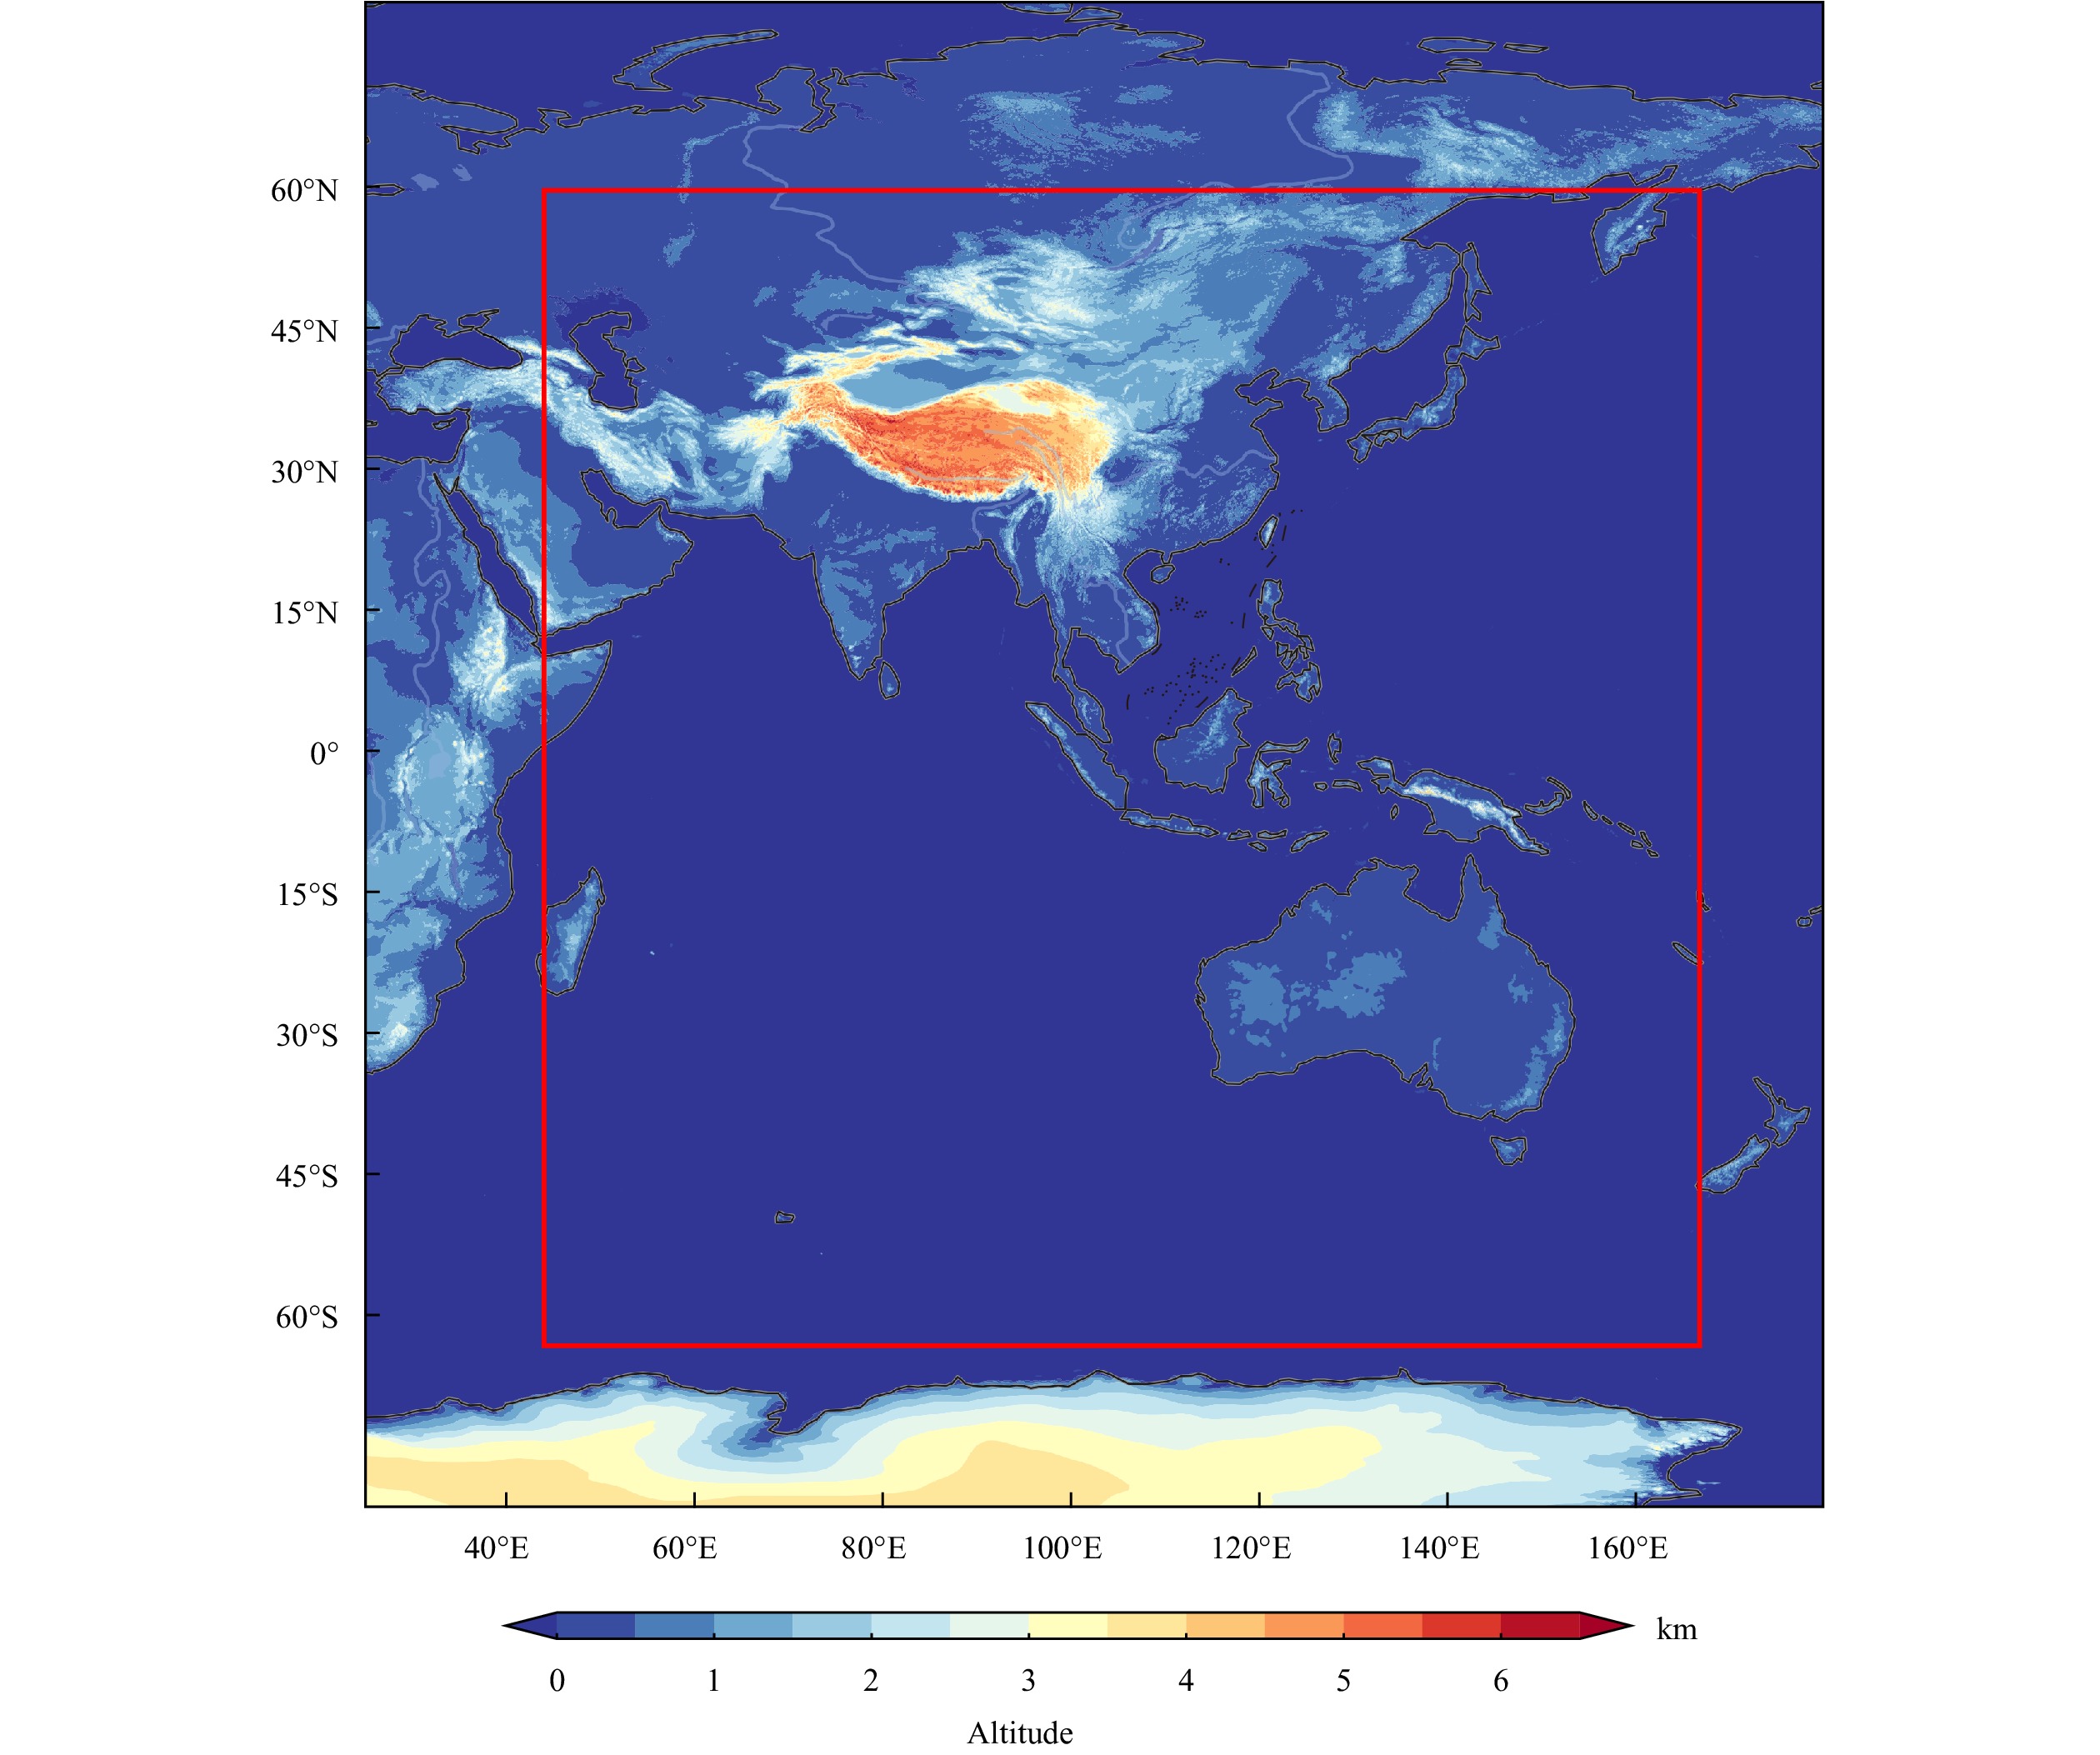
In this study, the FY-4A AGRI LWIR bands were utilized to develop the model for generating the MWIR band for the midnight hours. To construct the dataset for building the AI model, the following specific criteria were adopted for selecting MWIR and LWIR observations (i.e., BTs of bands 8–14): during stray light contamination periods, only FY-4A data at 1500 and 1900 UTC were utilized; for months with normal MWIR measurements, FY-4A data at 1600, 1700, and 1800 UTC were all used. The level-1 full-disk data were projected to a 0.04° × 0.04° grid using nearest-neighbor interpolation (Zhuge et al., 2024). Finally, the compiled dataset covered the period 2019–2020 and the area of 62.88°S–60.00°N, 44.00°–166.88°E (Fig. 1). To address computational limitations, the study area at each observation time was segmented into 36 samples, with each sample comprising 512 × 512 pixels. This segmentation resulted in a total of 44,584 samples, facilitating efficient training.
Fig
1.
The study area indicated by the red rectangle.
2.2
GK-2A AMI data
The GK-2A satellite, currently positioned at 128.2°E, is the new generation geostationary meteorological satellite of the Korea Meteorological Administration. It carries a multispectral imager, i.e., the AMI, which provides full-disk scans of earth at 10-min intervals. This study employed only the AMI MWIR band at 3.83 μm and the LWIR band at 12.36 μm. The data retrieved by each of these two channels have 2-km spatial resolution.
2.3
Himawari-8 AHI data
The Himawari-8 satellite, launched by the Japan Meteorological Agency, is positioned with sub-satellite longitude of 140.7°E (Bessho et al., 2016). The key instrument onboard the Himawari-8 platform, i.e., the AHI, has 16 visible and IR channels with spatial resolutions of 0.5–2.0 km and observation frequency of 10 min (Iwabuchi et al., 2016). This study utilized only the AHI MWIR band at 3.85 μm and the LWIR band at 12.35 μm.
2.4
Model architecture
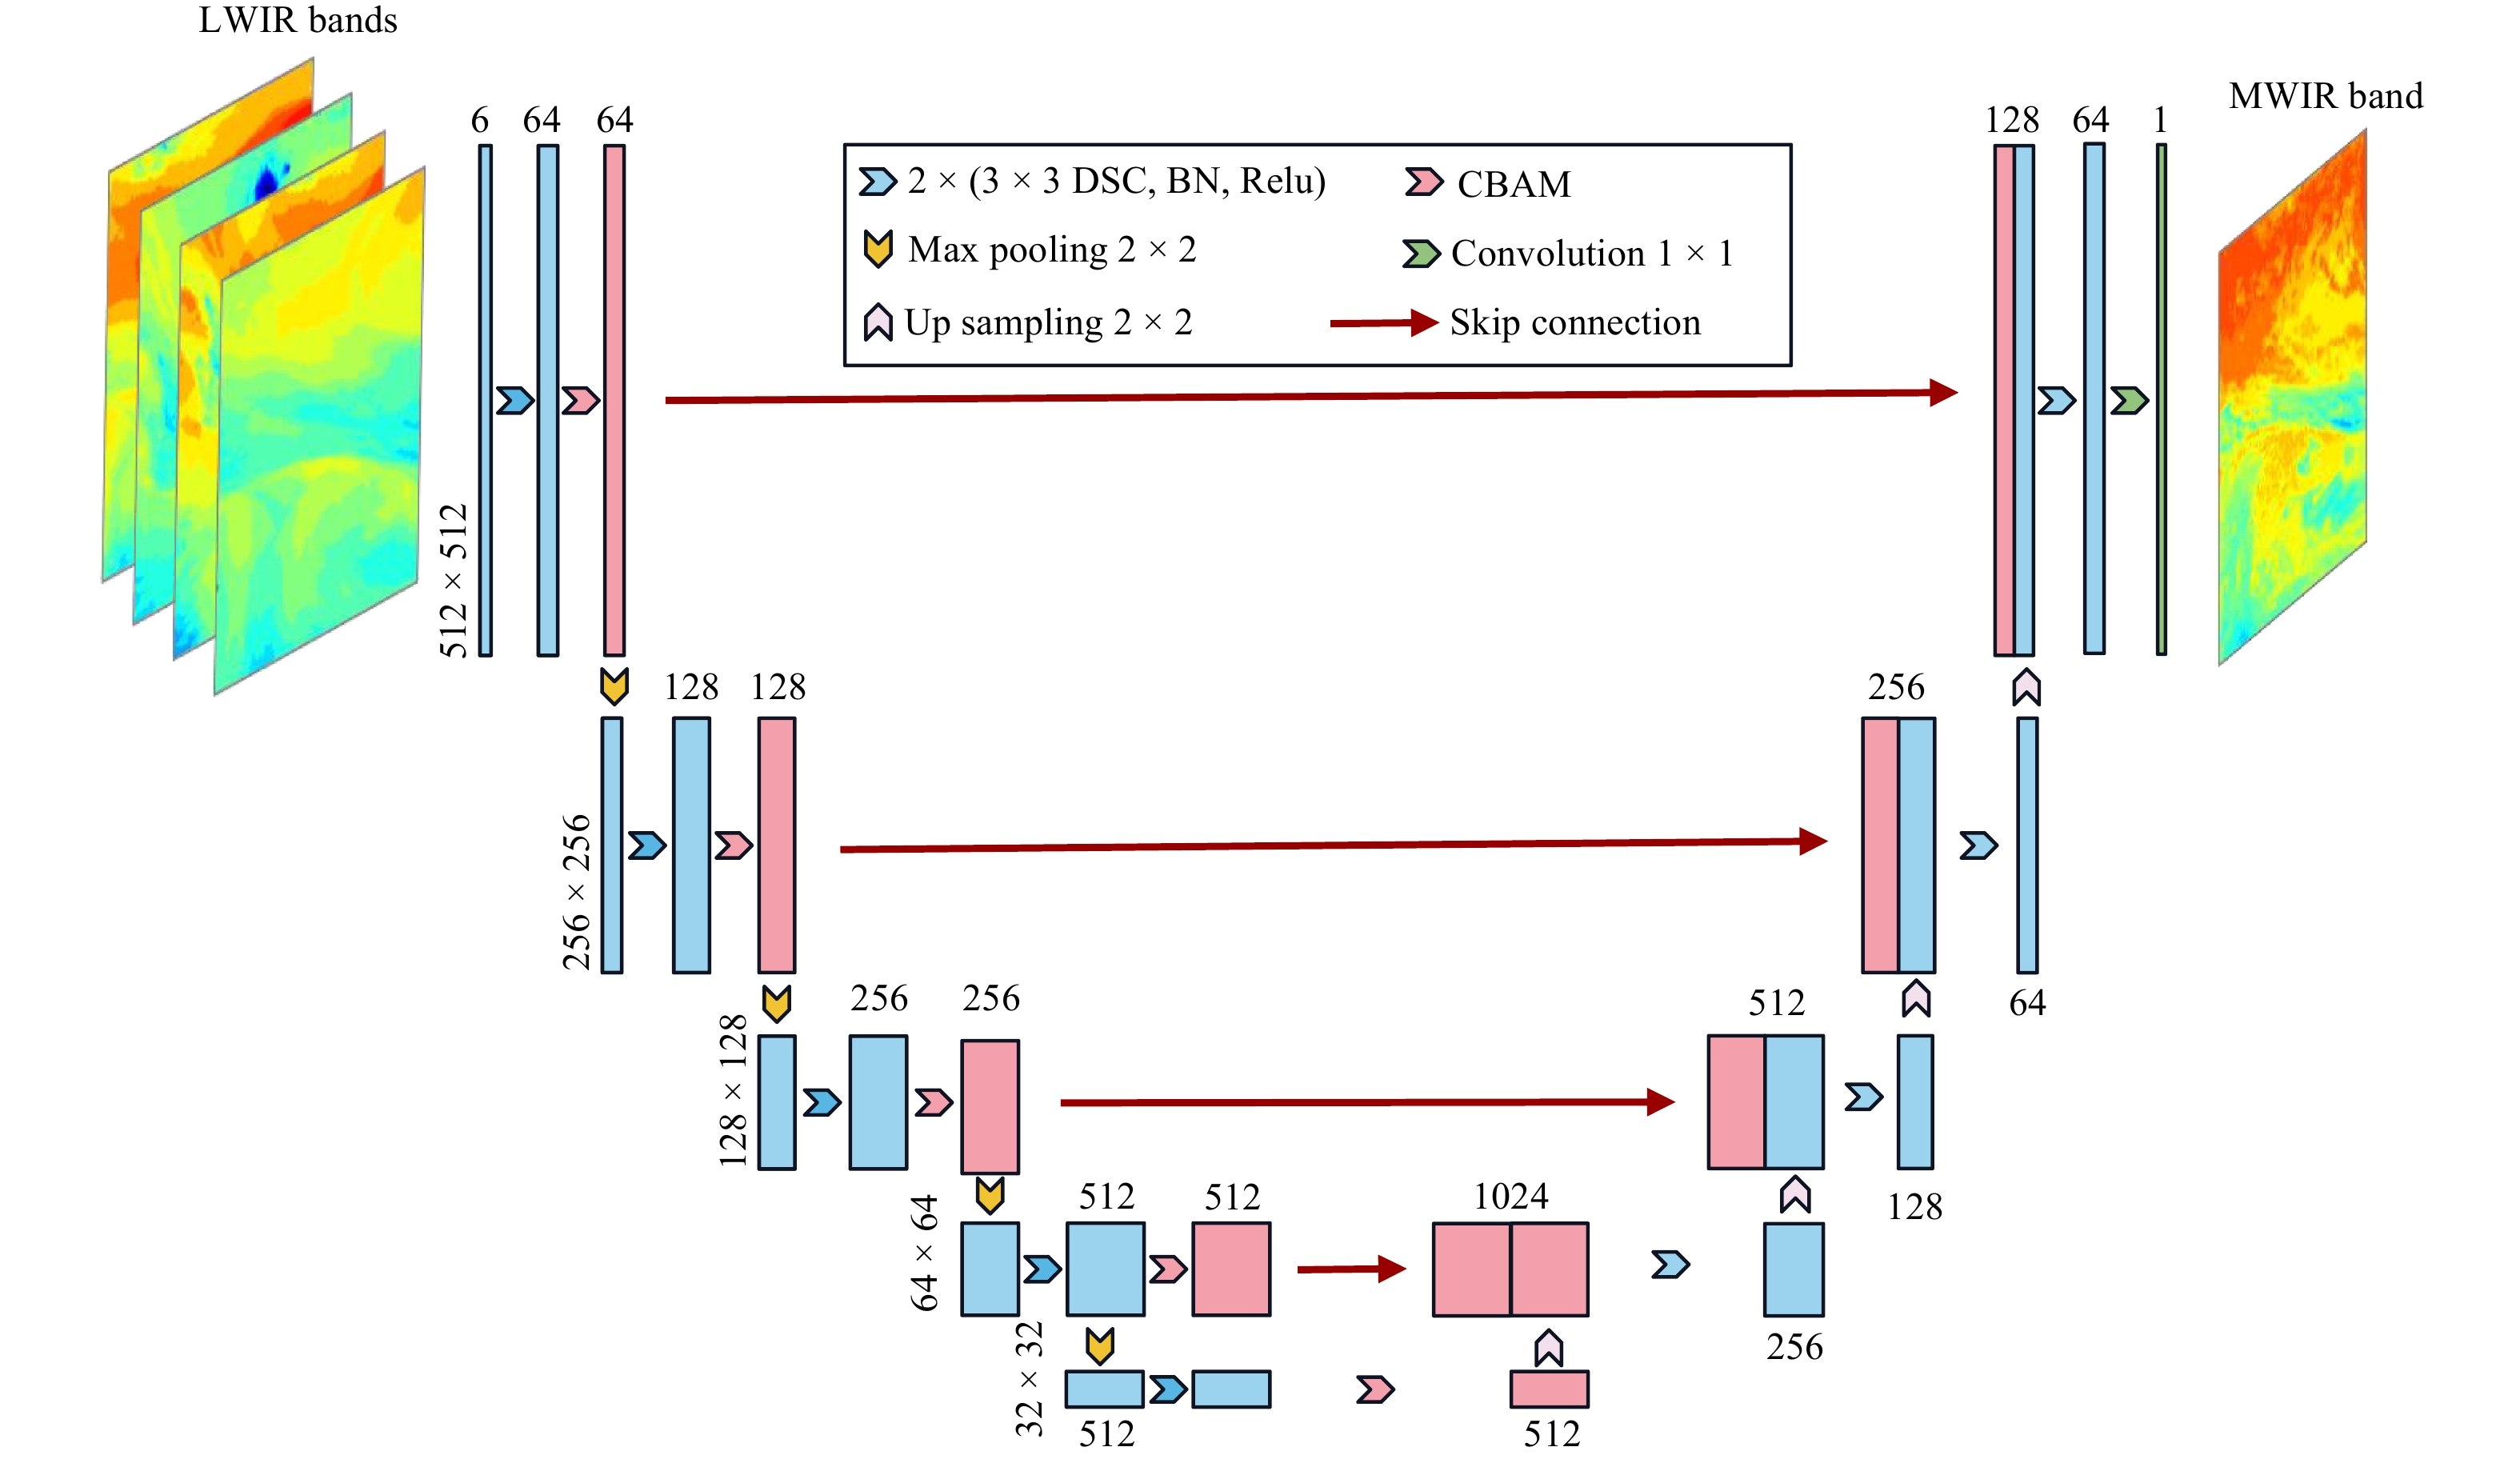
The U-Net architecture, characterized by its distinctive U-shaped encoder–decoder structure, includes a contracting path that captures contextual information and a symmetric expanding path for precise localization. Additionally, it supports multiscale feature extraction and integrates skip connections to enhance performance (Trebing et al., 2021). Building upon the U-Net framework proposed by Ronneberger et al. (2015), Trebing et al. (2021) introduced Small Attention-UNet (SmaAt-UNet) that incorporates two key enhancements. First, it integrates the convolutional block attention module (Woo et al., 2018) mechanism into the encoder part to amplify (suppress) important (unimportant) features at the corresponding image scale. Second, it leverages depth-separable convolution (Chollet, 2017) to convert conventional convolution operations, thereby reducing the number of parameters. Initially designed for forecasting precipitation, SmaAt-UNet was adapted in this study for the regression task of generating MWIR BTs. The structure of the SmaAt-UNet model (hereafter, the U-Net model) is shown in Fig. 2. The inputs of the model are LWIR band BTs and the output label is the MWIR BT. It should be noted that the MWIR band is weakly affected by carbon dioxide in the low troposphere, which means that the radiance would be observed with obvious transmission attenuation at large sensor zenith angles. However, during model training, two water vapor absorption bands (i.e., bands 9 and 10) and one carbon dioxide absorption band (i.e., band 14) were included, enabling the model to learn the absorption effects of water vapor and carbon dioxide, and thus the sensor zenith angle is not required to serve as an input.
Fig
2.
The deep learning model used for generating the MWIR band. BN indicates batch normalization, Relu indicates activation function, and the pink and blue rectangular boxes are feature maps. DSC: depth-separable convolution, CBAM: convolutional block attention module.
2.5
Experimental setting
The 44,584 samples were divided into a training set of 35,667 samples (from January 2019 to August 2020), a validation set of 4458 samples (from September to October 2020), and a testing set of 4459 samples (from November to December 2020). The training set was utilized for model training, whereas the validation set was employed to assess model performance during training. Regarding the training settings, the batch size was set to 8 and the Adam optimizer was used (Kingma and Ba, 2014). The mean squared error loss was adopted as the loss function, which is commonly utilized in regression problems (Veillette et al., 2020; Huangfu et al., 2024). Initially, the learning rate was set to 0.0001, and it was reduced by a factor of 0.3 if the loss did not decrease after every 5 epochs of training. The model was trained for a total of 80 epochs.
After obtaining the trained U-Net model, its performance was evaluated using the testing set by employing evaluation metrics that included the mean absolute error (MAE), root mean square error (RMSE), and Pearson’s correlation coefficient (R). Additionally, the model was also applied during the periods of stray light contamination in 2021 (i.e., 1600–1800 UTC in March, April, September, and October 2021) to further validate its effectiveness. The outputs of the U-Net model (denoted as AI-generated AGRI MWIR BTs) were compared with those observed by both the GK-2A AMI and the Himawari-8 AHI for reference. All experiments in this study were implemented using Python and PyTorch, and executed using NVIDIA GeForce Ray Tracing Technology 3090 Graphics Processing Units with the Compute Unified Device Architecture 11.1 library.
3.
Results
3.1
Evaluation using normal radiance measurements
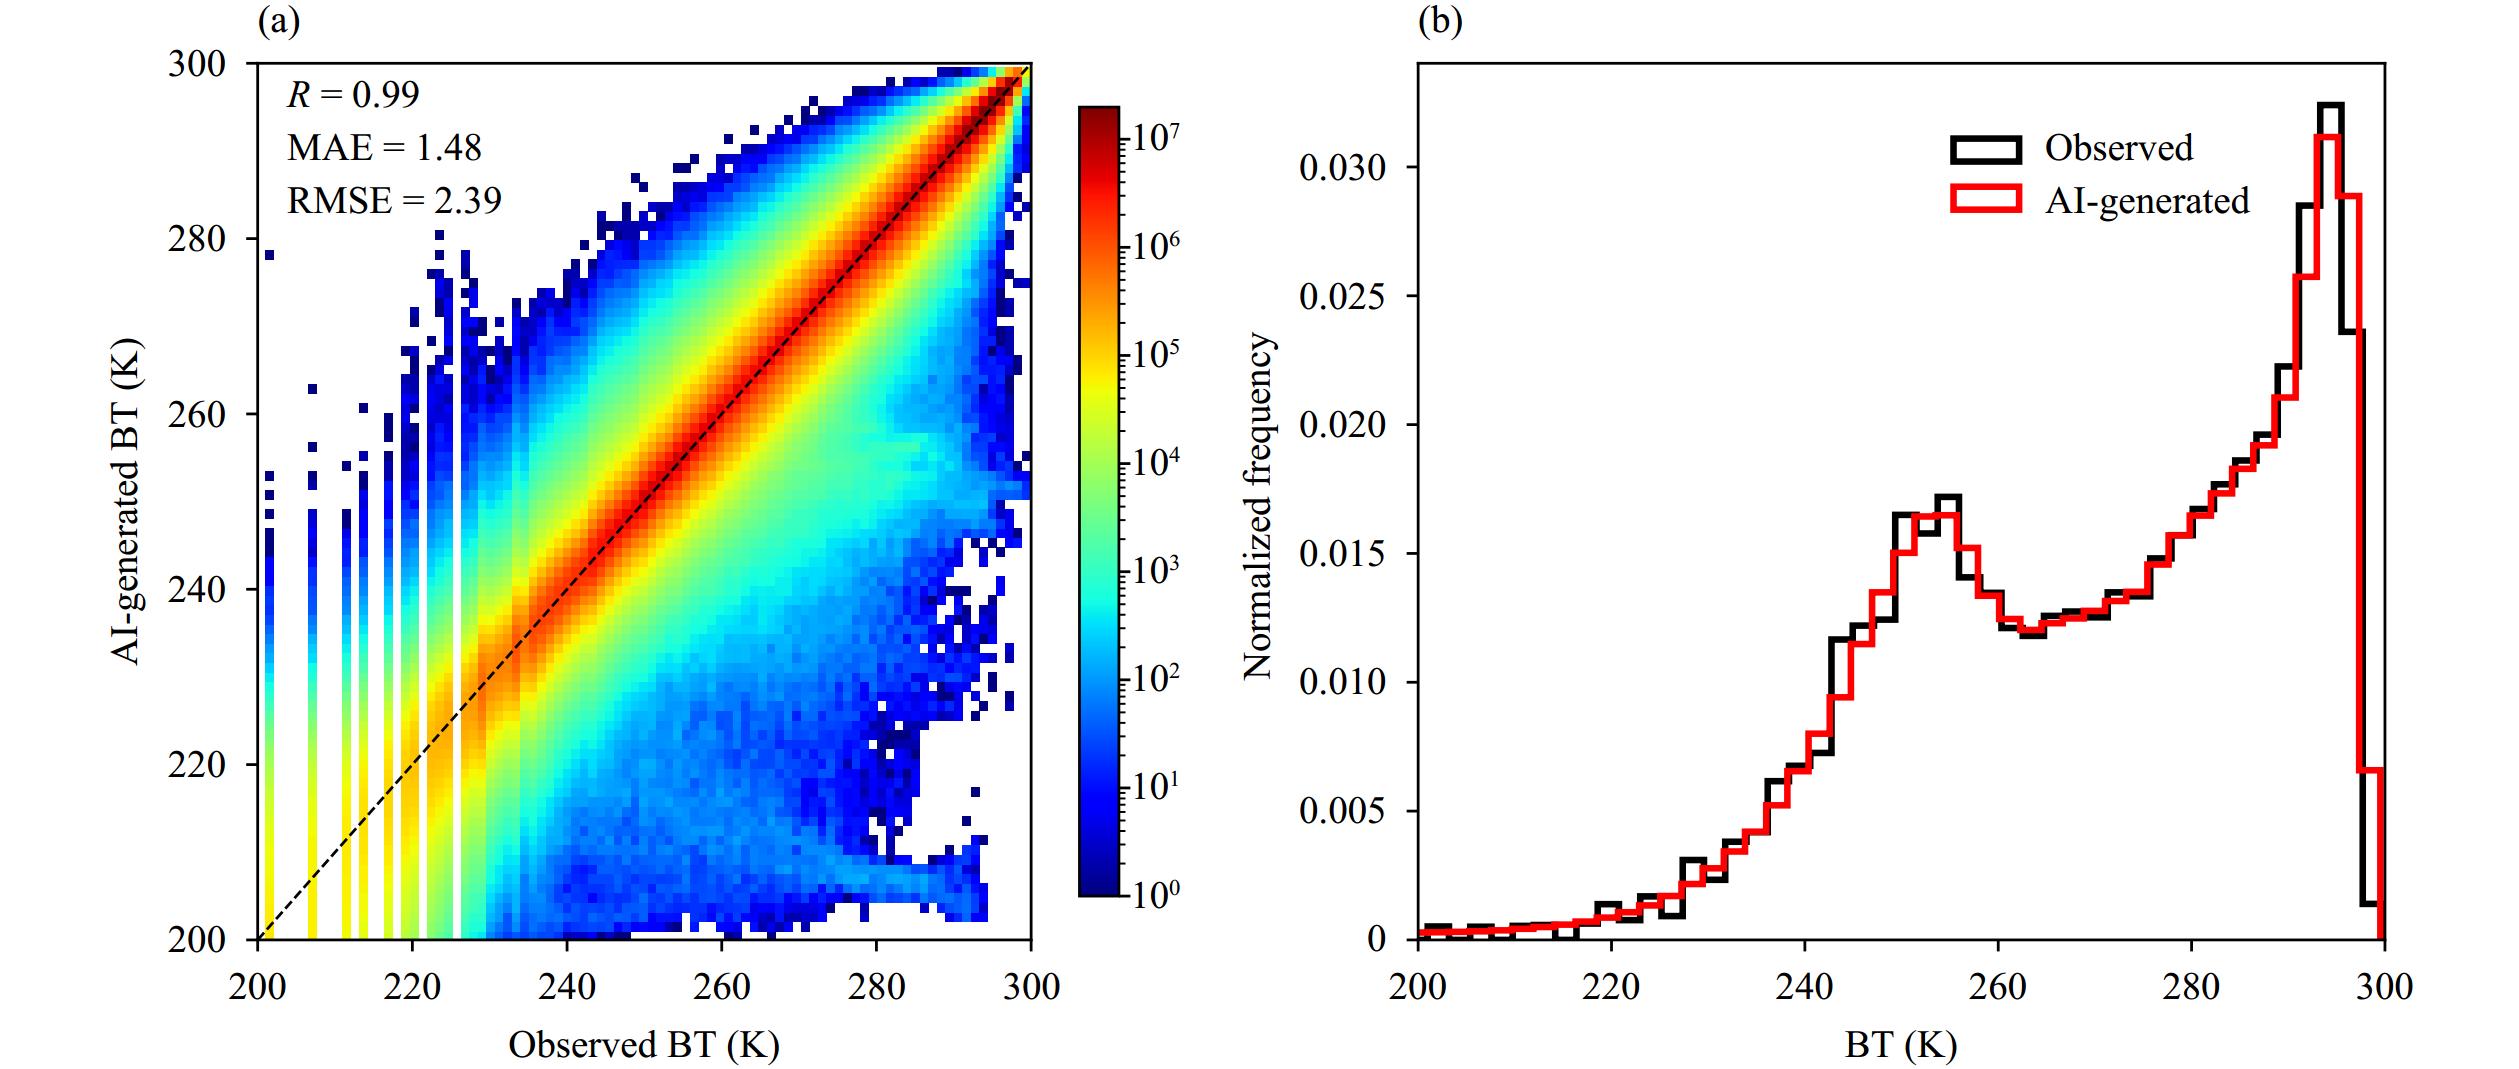
We used the testing dataset to evaluate the performance of the U-Net model in generating the MWIR band. Figure 3 shows pixel-by-pixel AI-generated MWIR BTs compared with normal FY-4A AGRI observations. It is evident that the AI-generated BTs closely align with the FY-4A AGRI observations (Fig. 3a). The AI-generated BTs are densely concentrated near the 1 : 1 line, indicating minimal estimation differences (MAE = 1.48 K, RMSE = 2.39 K, and R = 0.99). Furthermore, the probability density functions shown in Fig. 3b demonstrate that the frequency distribution of the AI-generated BTs closely mirrors that of the FY-4A AGRI MWIR measurements with exceptional accuracy. This alignment is especially pronounced in the BT range of 260–290 K, where the AI-generated BTs almost match perfectly with the actual observations.
Fig
3.
Pixel-by-pixel AI-generated MWIR BTs compared with AGRI observations: (a) density scatter plots of observations and generated BTs and (b) probability density functions.
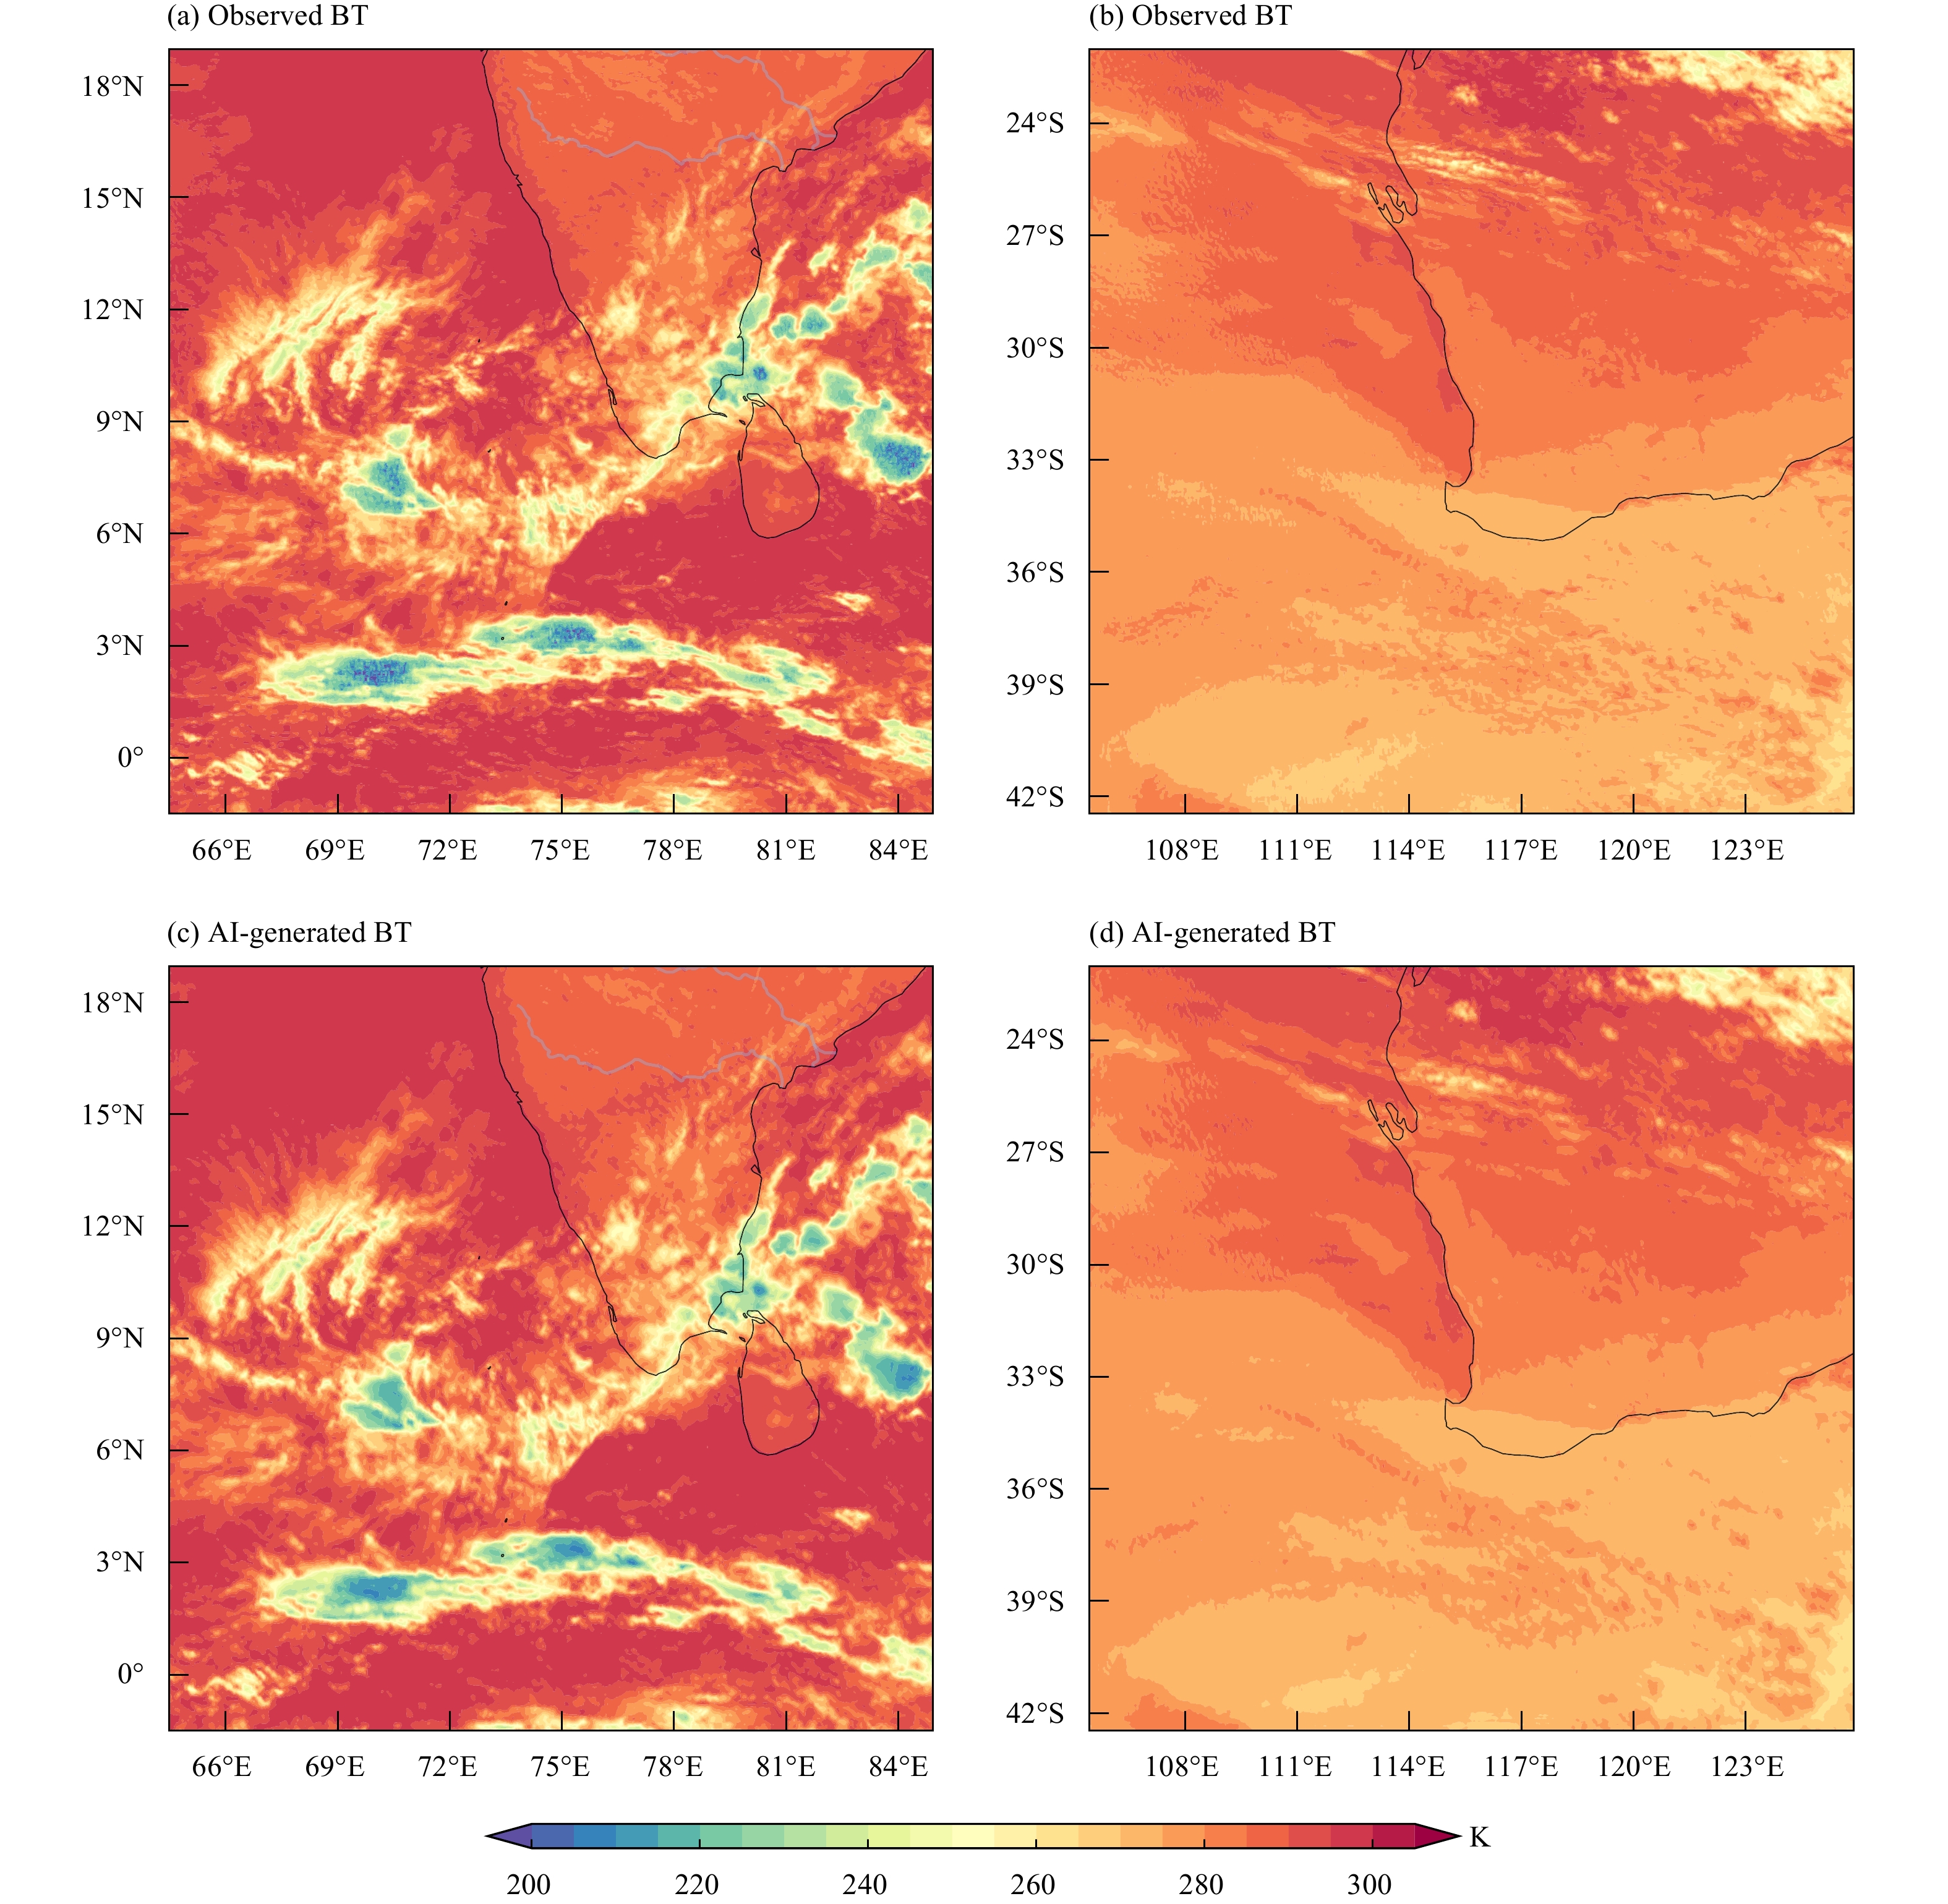
Moreover, we provide examples from the testing set to further illustrate the performance of the U-Net model in generating the MWIR band. Figure 4 displays the AI-generated results and the observations of two distinct areas at 1800 UTC 5 December 2020, each covering an area of 512 × 512 grid points. The AGRI-observed BTs over land in southern India fall predominantly within the range 260–290 K (Fig. 4a). Over the Indian Ocean, the recorded BTs exhibit a broader range, peaking at approximately 300 K and plunging to around 210 K. The U-Net model is effective in producing BTs over both ocean and land areas, with low-BT regions closely aligning with the observations (Fig. 4c). In western Australia and the Indian Ocean region (Fig. 4b), the FY-4A AGRI-observed BTs consistently exceed 250 K. Generally, the BTs over Australia are higher than those over the southern Indian Ocean region. Similarly, the AI-generated BTs accurately capture this contrast with only minor discrepancies (Fig. 4d). Overall, these cases affirm the precision of our model in generating BTs for the MWIR band. By applying this model, there is promising potential to effectively rectify abnormal BTs during periods of stray light contamination.
Fig
4.
Comparison of (a, b) observed and (c, d) AI-generated MWIR band BTs at 1800 UTC 5 December 2020. Note that (a) and (c) cover southern India and the Indian Ocean region, and (b) cover Western Australia and (d) the Indian Ocean region.
3.2
Application during stray light contamination periods
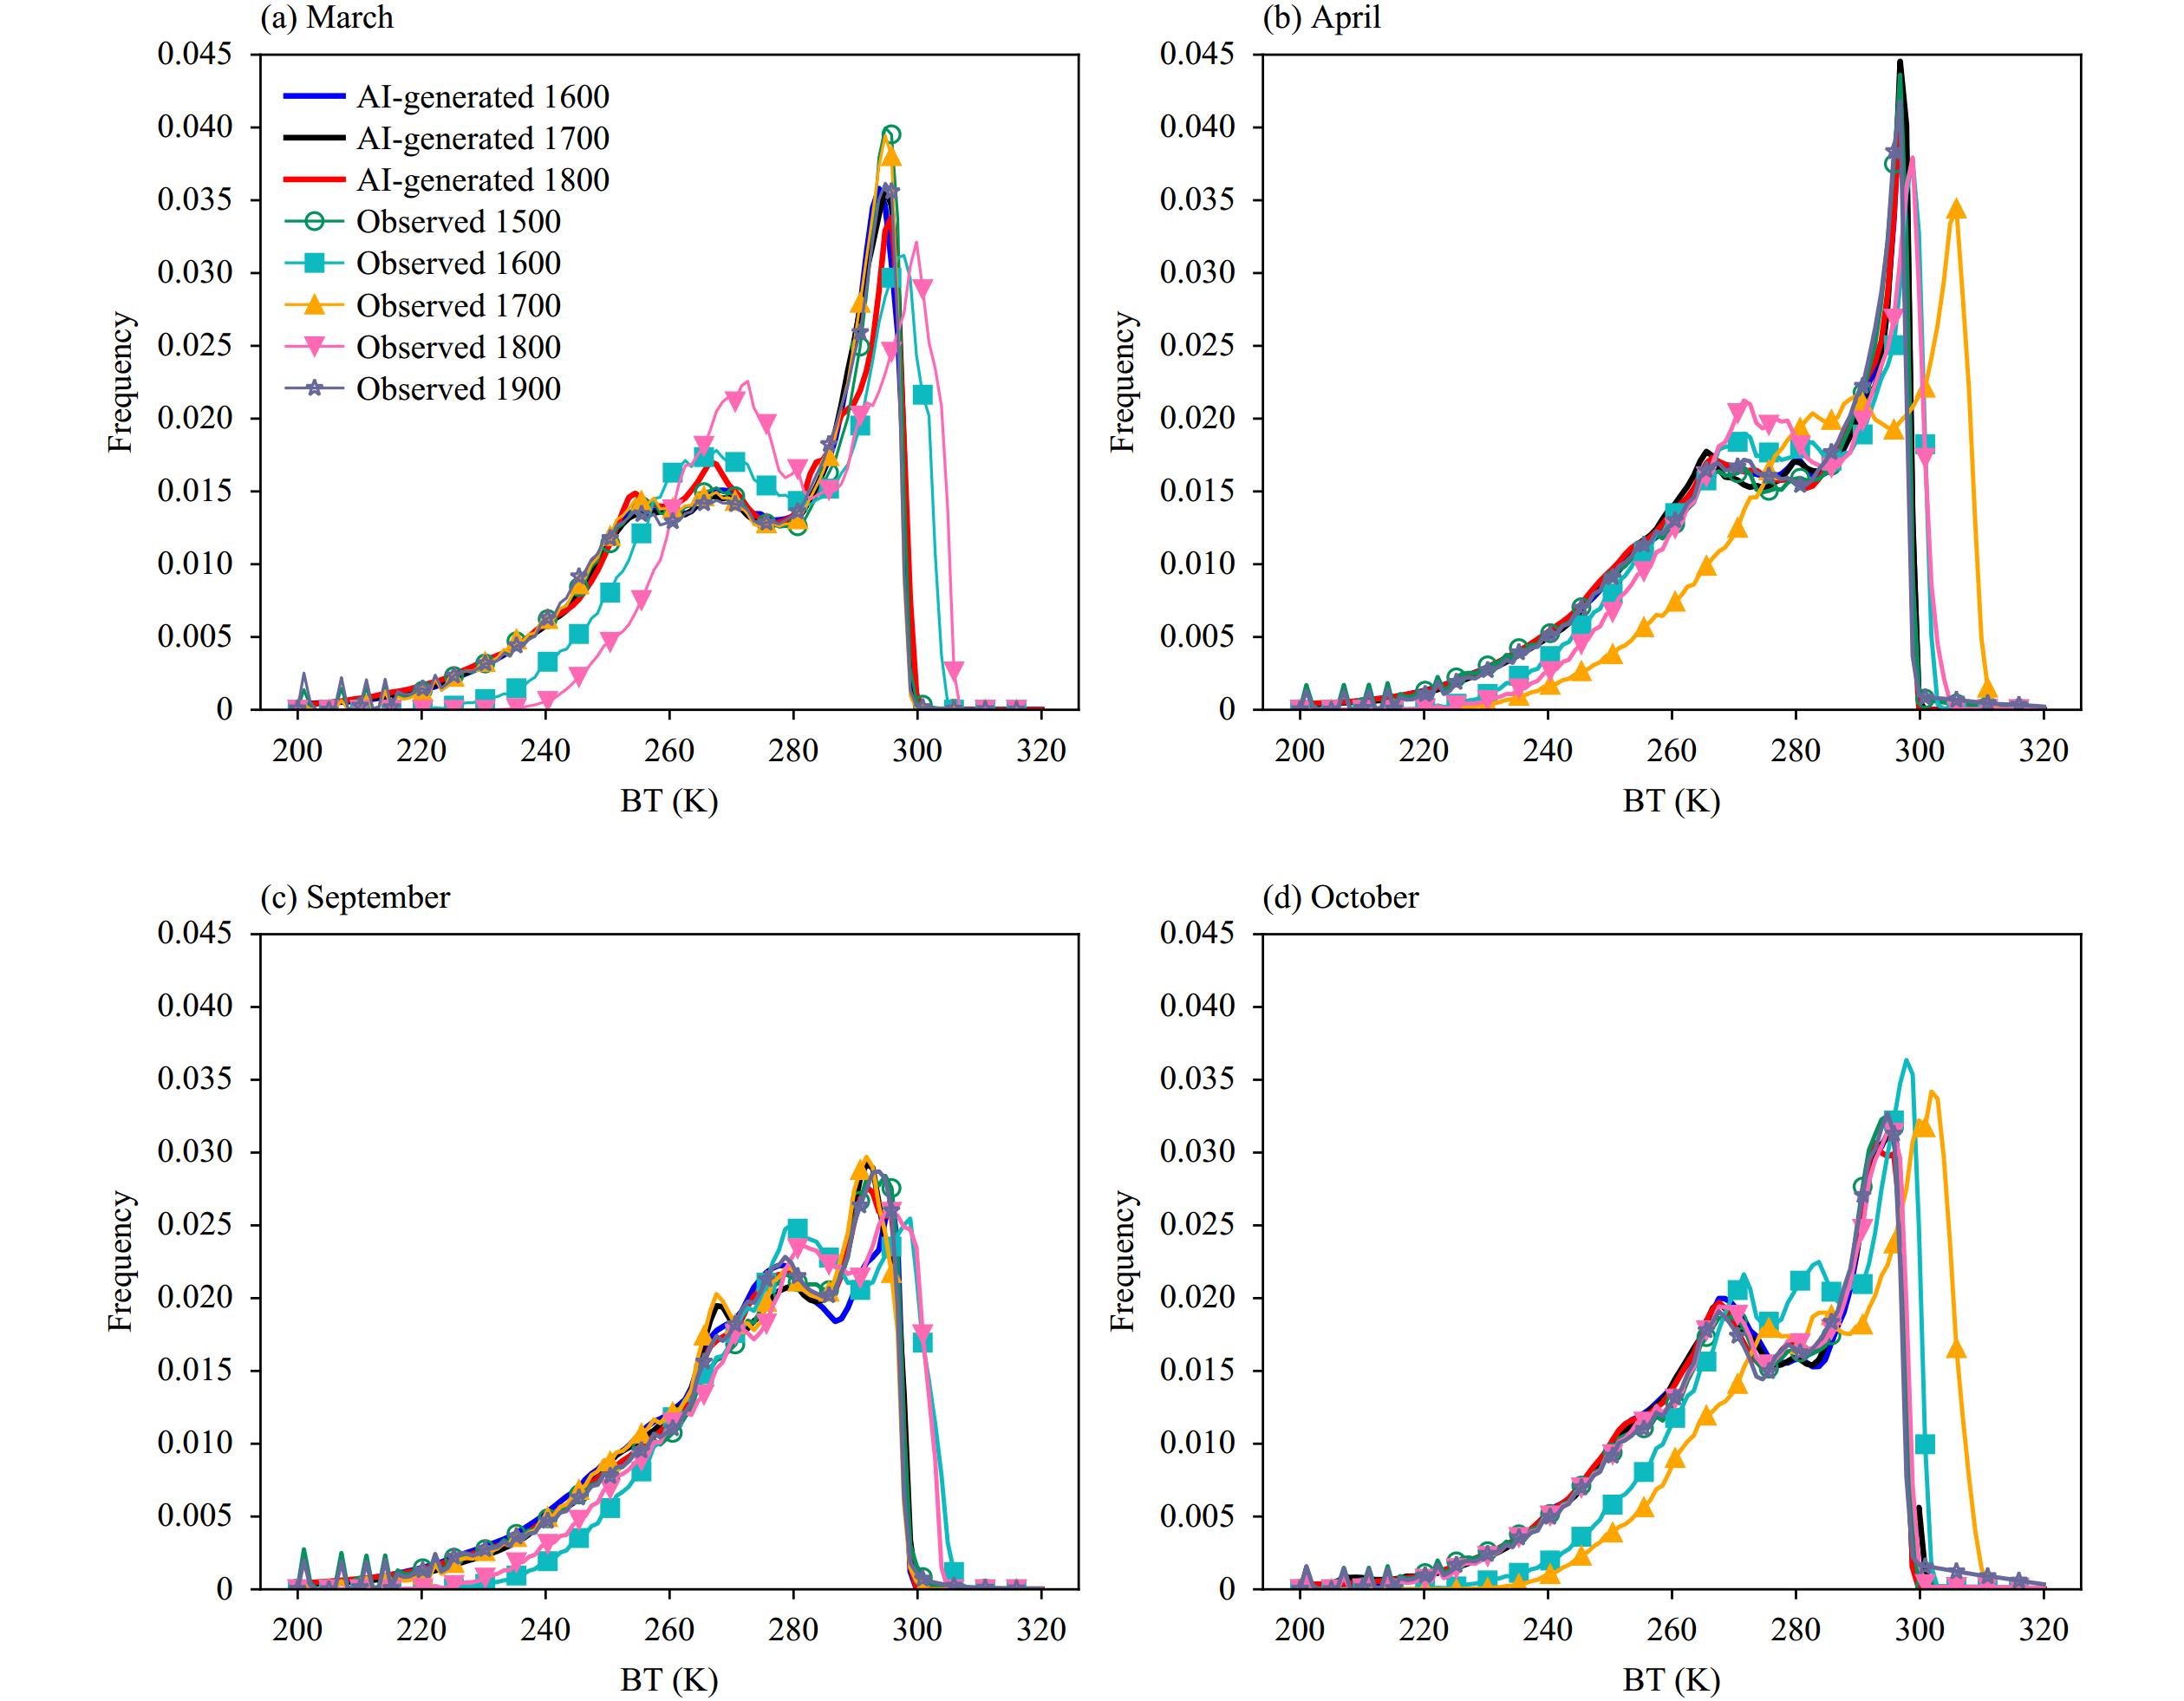
We applied the U-Net model during periods of stray light contamination (1600–1800 UTC) to the observed MWIR band across March, April, September, and October 2021 to assess its effectiveness. Figure 5 illustrates the frequency distribution of MWIR BTs within 1-K intervals for the FY-4A AGRI-observed and AI-generated results. Here, observations from 1500–1900 UTC in each month are displayed for comparison, with 1500 and 1900 UTC representing periods of normal observation. The results indicate that the observed BTs during 1600–1800 UTC are overestimated to varying degrees and fail to accurately represent low BTs. Because the extent of the overestimation varies by month, we conducted separate analyses for each month.
Fig
5.
Frequency distribution of observed (1500, 1600, 1700, 1800, and 1900 UTC) and AI-generated (1600, 1700, and 1800 UTC) MWIR BTs within 1-K intervals in (a) March, (b) April, (c) September, and (d) October 2021.
In March (Fig. 5a), observed BTs at 1600 and 1800 UTC are subject to varying degrees of overestimation, with BTs exceeding 300 K in both cases. Within the BT range 260–280 K, the observations exhibit a broader distribution compared with that of observations at 1500 and 1900 UTC. Notably, the overestimation of BTs at 1800 UTC is most pronounced, with the observed minimum BT (~230 K) markedly higher than the minimum BT at 1500 and 1900 UTC (~200 K). In contrast with the observations, the AI-generated BTs at 1600 and 1800 UTC in March are closer to the observations at 1500 and 1900 UTC, respectively, effectively bringing the BTs back to below 300 K. At 1700 UTC, the observed BTs exhibit reasonable consistency with the BTs at 1500 and 1900 UTC, with no notable overestimation. In April (Fig. 5b), the minimum observed BTs at 1600–1800 UTC exceeds 220 K, with the maximum BTs surpassing 300 K. Notably, the observed BTs at 1700 UTC exhibit the most severe overestimation, with a wide range of values exceeding 300 K. However, in contrast with the observations, the AI-generated BTs at 1600–1800 UTC align well with those at 1500 and 1900 UTC.
Similar to March, only the BTs observed at 1600 and 1800 UTC in September exhibit overestimation (Fig. 5c). The AI-generated BTs are essentially consistent with the distribution of BTs during the normal period. In October (Fig. 5d), AGRI-observed BTs at 1600 and 1700 UTC are overestimated to varying degrees, and the spatial range of the overestimated temperatures between 260 and 300 K at 1600 UTC is excessively broad. The overestimation by the AGRI-observed BTs is more severe at 1700 UTC than at 1600 UTC. The AI-generated results for 1600 and 1700 UTC are consistent with the observations during normal periods. Overall, the model established for generating the AGRI MWIR band performs effectively during 1600–1800 UTC, largely eliminating abnormal BTs.
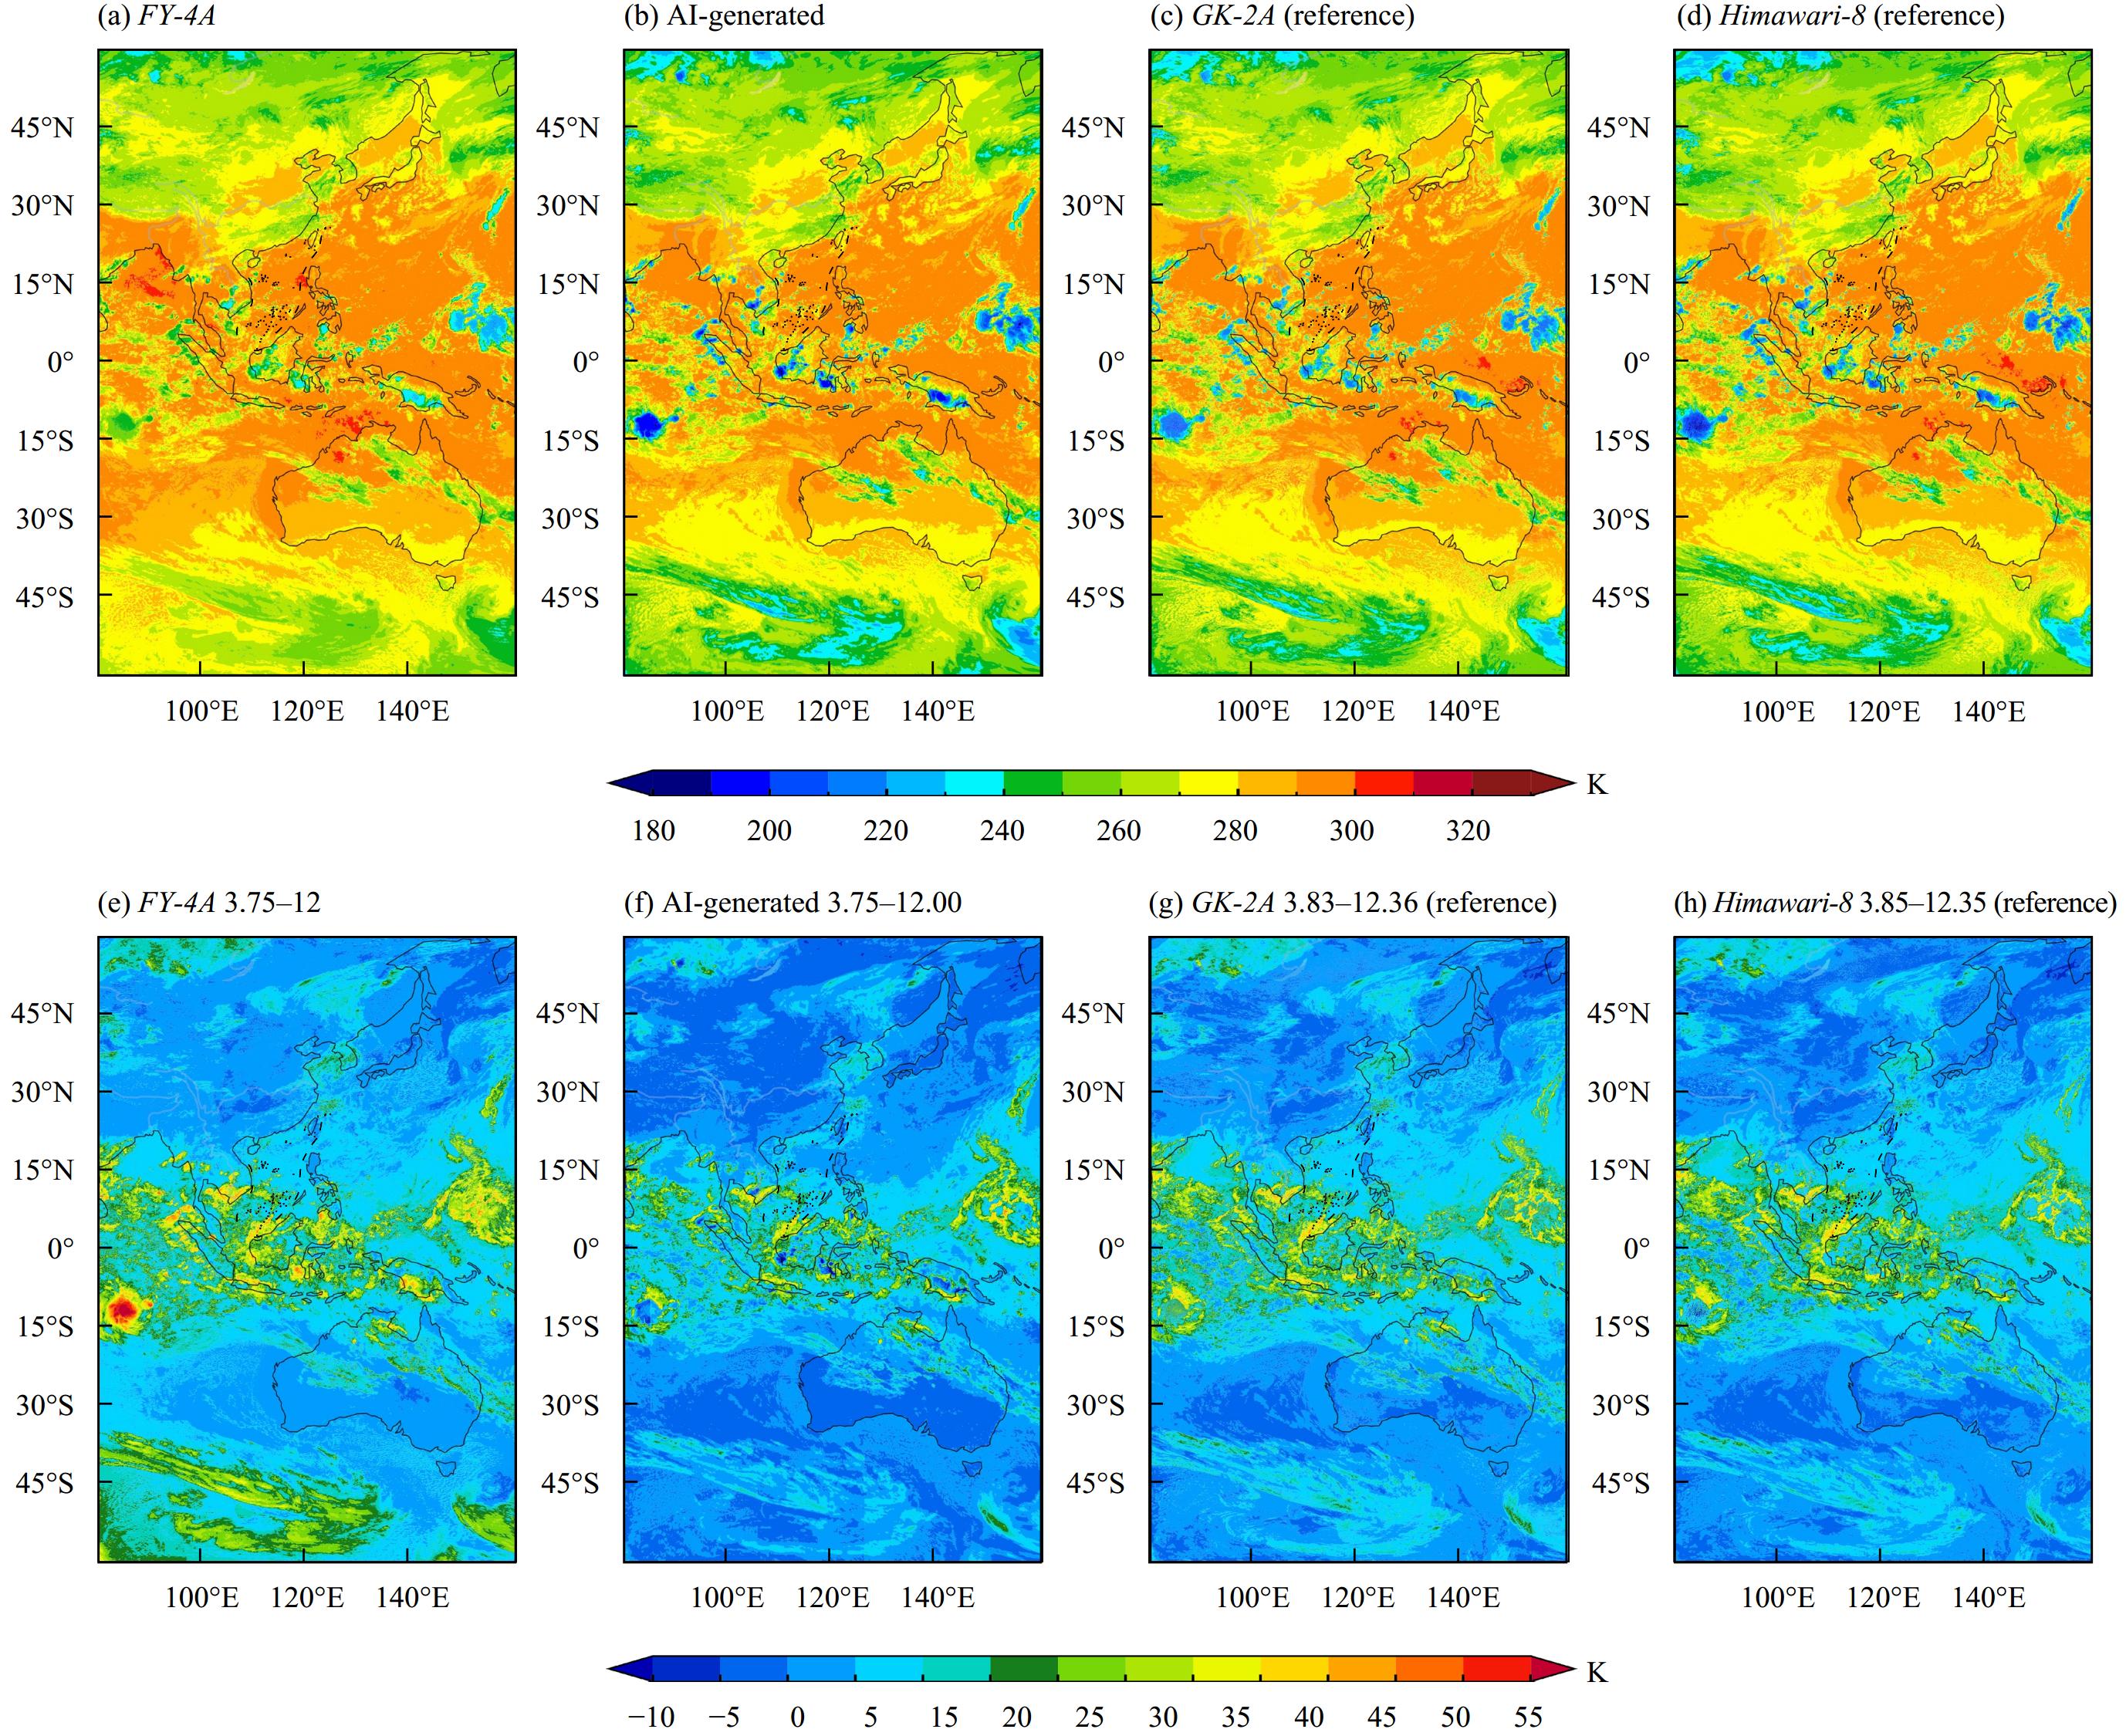
For a more intuitive evaluation of the effectiveness of the U-Net model, two examples during periods of stray light contamination are shown in Figs. 6, 7. Owing to the absence of true observations during stray light contamination periods, we used observations from both the GK-2A AMI and the Himawari-8 AHI as references to qualitatively evaluate the performance of the U-Net model. Specifically, the GK-2A AMI (3.83 µm) and the Himawari-8 AHI (3.85 µm) MWIR bands were used. To minimize observational time differences between the satellites as much as possible, the starting observation time for the GK-2A AMI and Himawari-8 AHI data is consistent with that of the FY-4A AGRI data. It should be noted that the sub-satellite longitude of the FY-4A, GK-2A, and Himawari-8 satellites is 104.7°E, 128.2°E, and 140.7°E, respectively; therefore, the observation geometries (such as sensor zenith angles) differ among the three platforms. Meanwhile, the MWIR band central wavelength and spectral response function for each of the three sensors are also not the same. The MWIR BTs from the GK-2A AMI or Himawari-8 AHI cannot be considered true values for the AI-generated MWIR BTs. The BT differences (BTDs) between the MWIR and LWIR bands (former minus latter) are also provided for evaluation. It is known that water vapor absorption is different in the MWIR and LWIR spectrum, and the BTD values vary with cloud tops at different heights and/or with different thermodynamic phases. Therefore, the BTD images can show the performance of the AI model in predicting water vapor absorption.
Fig
6.
Comparisons of MWIR BTs (top row) and BTDs (bottom row) among the FY-4A AGRI-observed, AI-generated, GK-2A AMI-observed, and Himawari-8 AHI-observed BTs at 1600 UTC 29 October 2021.
Fig
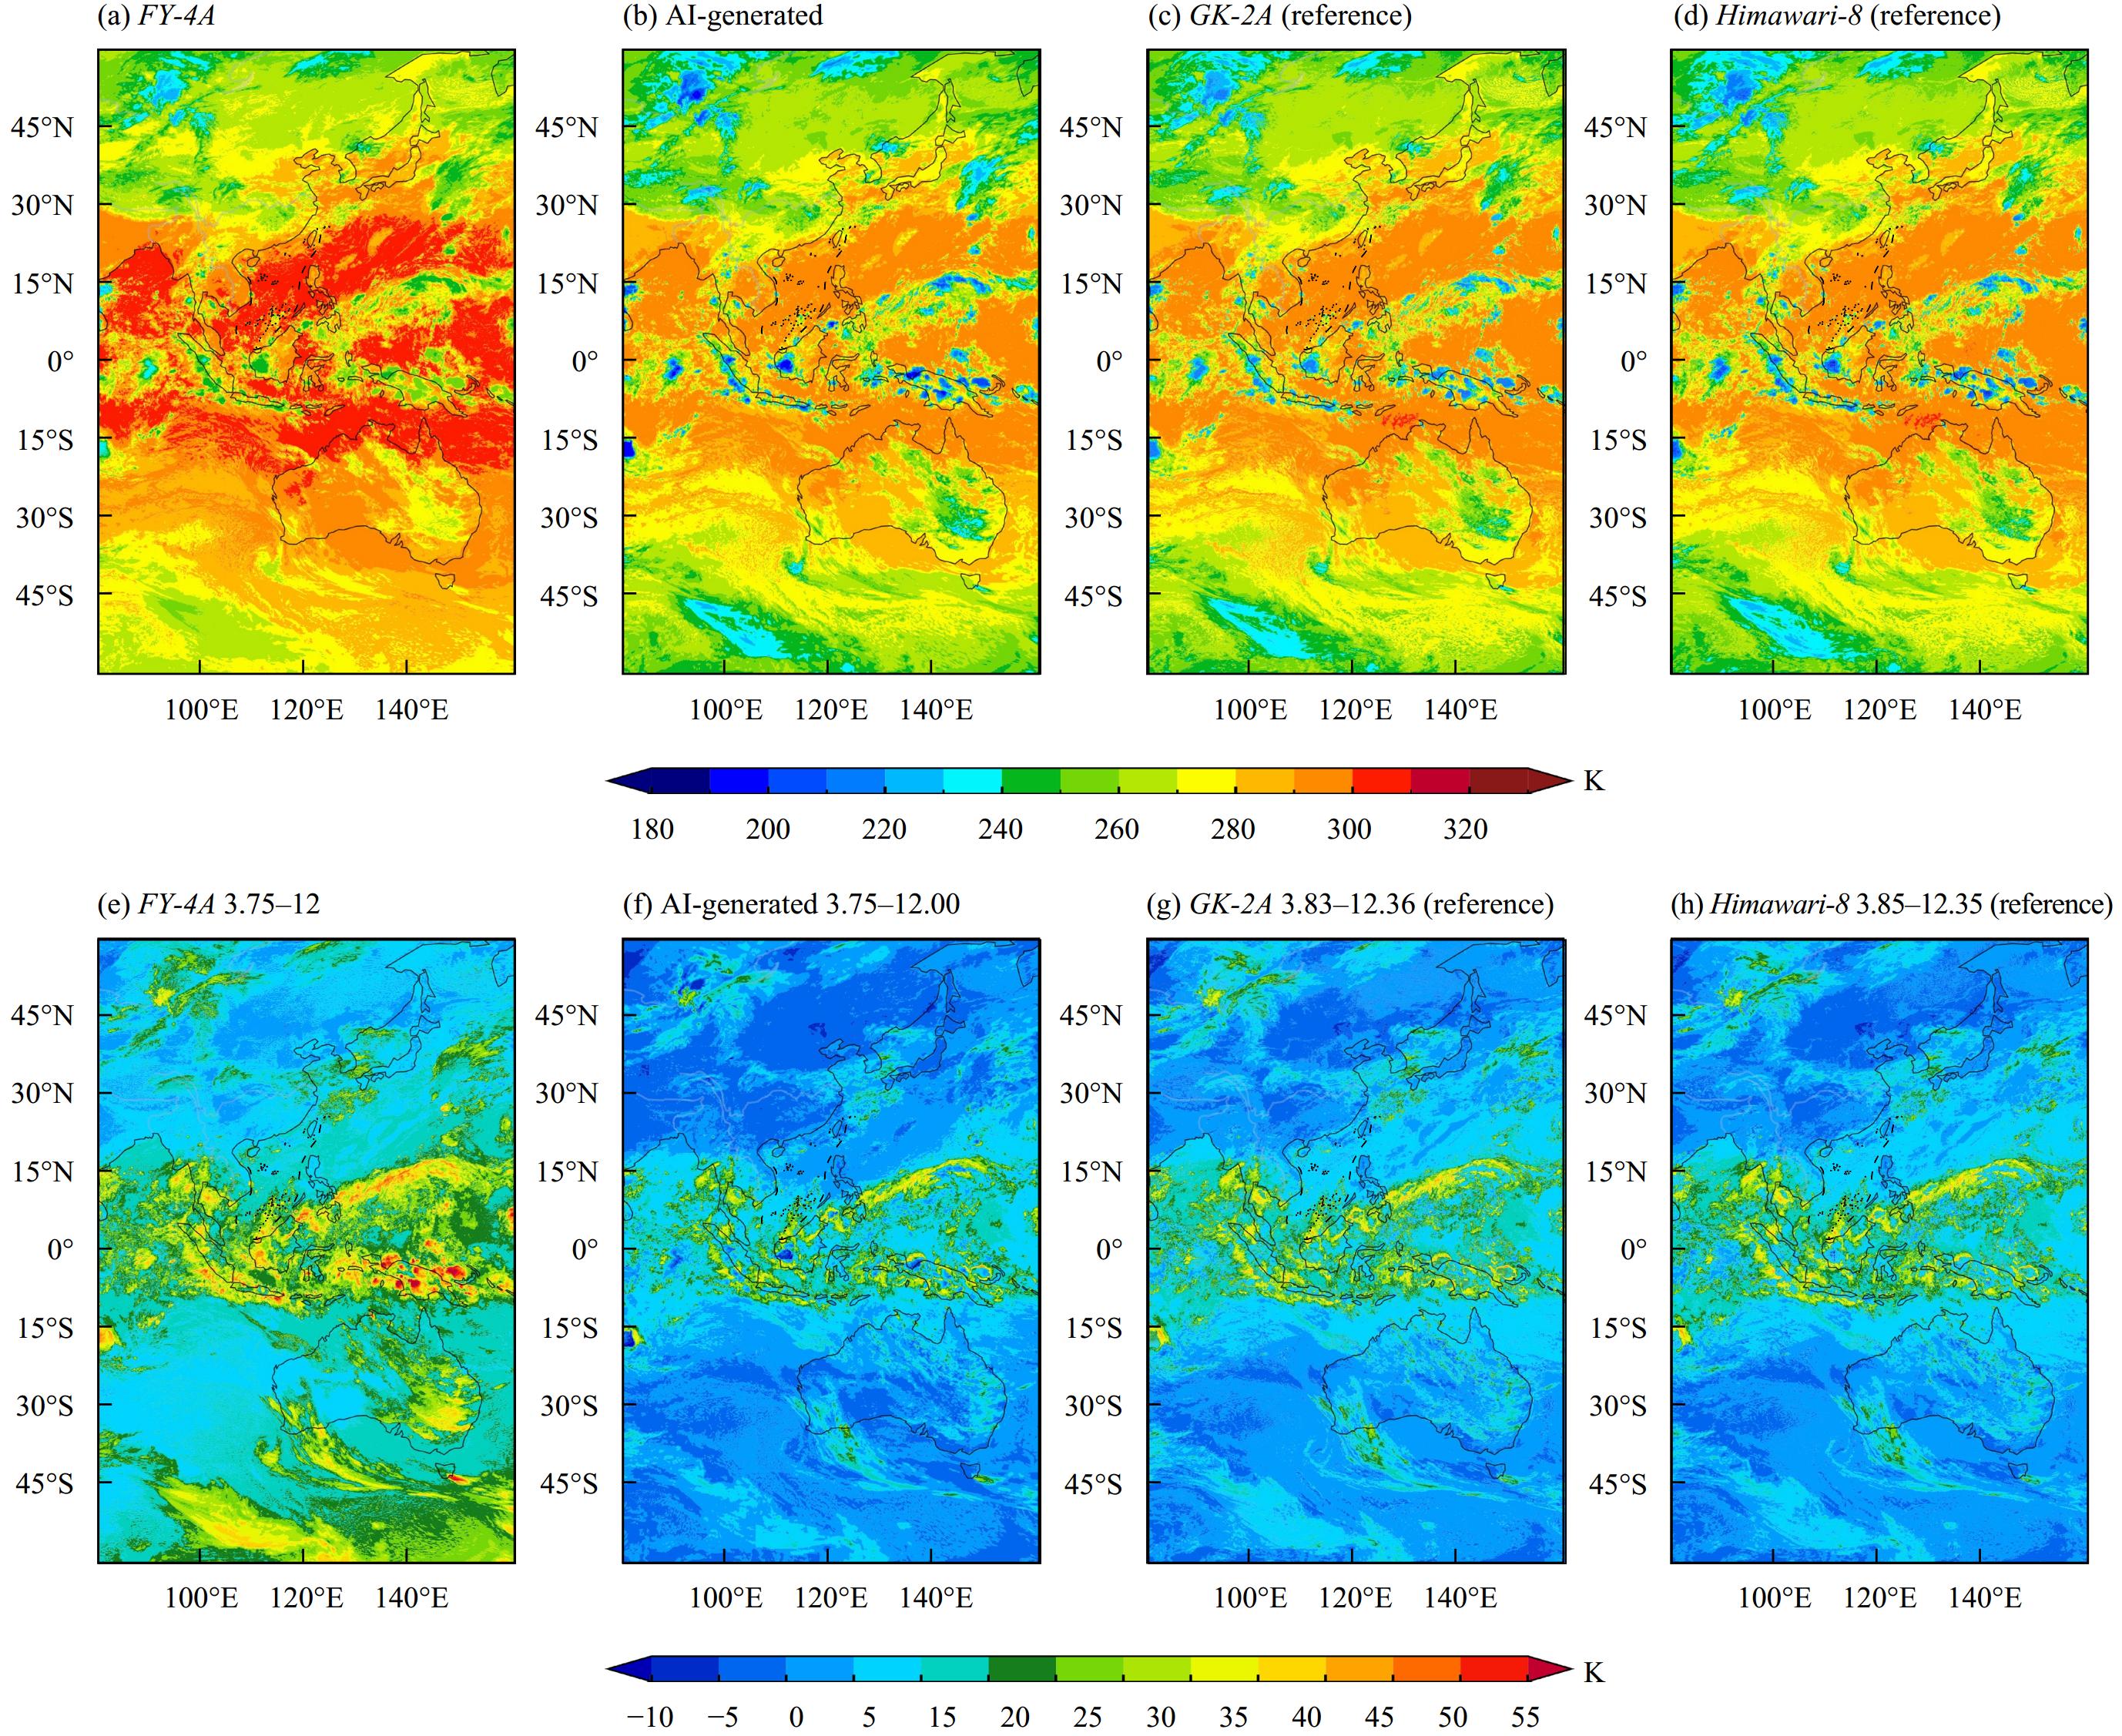
7.
As in Fig. 6, but for results at 1700 UTC 31 October 2021.
The first case represents 1600 UTC 29 November 2021. A low-BT area is evident over the Pacific Ocean, with a minimum BT of approximately 230 K, as illustrated in Fig. 6a. Most areas exhibit BTs of < 300 K, with only a few regions showing warmer temperatures exceeding 300 K, e.g., the Bay of Bengal and northern Australia. In comparison, the AI-generated BTs (Fig. 6b), which are < 300 K, demonstrate effective suppression of the occurrence of BTs exceeding 300 K. Meanwhile, areas with low BTs (i.e., < 210 K) newly emerge over the Indian Ocean, Indonesia, and the Atlantic region. Compared with the GK-2A AMI (Fig. 6c) and Himawari-8 AHI (Fig. 6d) data, the FY-4A AGRI shows higher MWIR BTs across all regions. The AI-generated BTs, however, exhibit good performance, particularly in the high-BT anomaly area over the Bay of Bengal and the low-BT regions of the Indian Ocean and the Pacific Ocean. It is worth noting that the AI-generated MWIR BTs are lower compared to those from GK-2A AMI and Himawari-8 AHI in low-BT regions. This discrepancy is reasonable, as FY-4A AGRI band 8 is more sensitive to low temperatures. Nonetheless, for regions where BTs are > 300 K in the GK-2A AMI and Himawari-8 AHI observations, such as the northern part of Australia and the western Pacific near Indonesia, the AI-generated BTs are all < 300 K. This discrepancy might reflect the fact that most of the training samples used for constructing the model were < 300 K, making it challenging for the U-Net model to generate BTs > 300 K. Additionally, by comparing the BTDs (Figs. 6e–h), it is evident that the BTs derived from the U-Net model closely resemble those observed by both the GK-2A AMI and the Himawari-8 AHI. In contrast, the BTDs relevant to the FY-4A AGRI are notably higher than those of both the GK-2A AMI and the Himawari-8 AHI.
Figure 7 presents the results of the second example at 1700 UTC 31 October 2021. It is evident that the observed BTs in most areas exceed 250 K. Particularly noteworthy are the regions within the Indo–Pacific area between 20°S and 20°N, especially over the ocean north of Australia, where BTs surpass 300 K (Fig. 7a). Analysis of the GK-2A AMI (Fig. 7c) and Himawari-8 AHI observations (Fig. 7d) reveals that within the Indo–Pacific region between 20°S and 20°N, BTs broadly do not surpass 300 K and there are areas with BTs < 210 K. In contrast, over regions of the ocean with low BTs, the FY-4A AGRI MWIR observations are anomalously higher by up to approximately 40 K. Over land, the observations also exhibit varying degrees of overestimation. Conversely, the AI-generated BTs (Fig. 7b) align closely with those observed by both the GK-2A AMI (Fig. 7c) and the Himawari-8 AHI (Fig. 7d) in most areas. The U-Net model effectively eliminates high BTs over maritime and land areas, as observed in regions such as Indo–Pacific area. The AI-generated BTs are notably closer to the MWIR observations of the Himawari-8 AHI, but exhibit lower BTs in low-BT regions (same as Fig. 6). Similarly, the U-Net model struggles to generate MWIR BTs exceeding 300 K, which explains why the AI-generated BTs do not correspond well with the GK-2A AMI and Himawari-8 AHI observations in the region of northern Australia. The BTD results (Figs. 7e–h) also show certain discrepancies. Nevertheless, the AI-generated results more accurately reflect the BTDs, which are closer to those observed by both the GK-2A AMI and the Himawari-8 AHI, thereby providing more accurate representation of high clouds. In summary, the model proposed in this study can effectively generate the AGRI MWIR band, and the MWIR BT anomalies are successfully suppressed during periods of stray light contamination.
4.
Conclusions
In this study, we introduced a U-Net-based AI approach for generating the MWIR band utilizing BT measurements from the FY-4A AGRI LWIR band. To build the model, we employed observations from normal observation periods that were used for training, validation, and testing. The AI-generated MWRI BTs exhibited strong agreement with the FY-4A AGRI observations, as indicated by MAE, RMSE, and R values of 1.48 K, 2.39 K, and 0.99, respectively.
The U-Net model was applied to periods of stray light contamination, e.g., 1600–1800 UTC in March, April, September, and October 2021. The results showed that the generated BTs effectively eliminate BT anomalies, aligning with the BT distribution found during uncontaminated observation periods (e.g., 1500 and 1900 UTC). Additionally, comparison with case results using GK-2A AMI and Himawari-8 AHI MWIR observations revealed strong agreement between the AI-generated BTs and the GK-2A/Himawari-8 observations. Overall, the U-Net model provides a more realistic representation of BTs over both land and ocean, and it can provide accurate MWIR BTs at 1600–1800 UTC.
Despite the excellent performance of the U-Net-based AI model, further improvements remain possible. During model construction, we primarily utilized MWIR BTs from the FY-4A AGRI recorded between 1500 and 1900 UTC, which were generally < 300 K. Consequently, the U-Net-based AI model did not learn to generate scenarios with BTs > 300 K. This limitation makes it challenging for the AI model to generate hot-spot temperatures (BT > 300 K). If more normal observations with BTs > 300 K were included during the training process, the AI model would theoretically be capable of generating hot-spot temperatures. Besides, thermal IR signals observed by satellite imagers are often dependent on the sensor zenith angles, due to the transmission attenuation with atmospheric path length. In future work, we will incorporate variables such as the sensor zenith angle as additional inputs, to further improve the AI model and evaluate their impact on the results.
Addressing the issue of stray light contamination of the FY-4 AGRI is imperative, especially for the FY-4B satellite that currently suspends observations around midnight because of this problem. The U-Net model proposed in this study successfully addresses the matter of abnormal MWIR BTs observed by the FY-4A AGRI during the spring and autumn equinoxes, offering important insights into the generation of reliable AGRI MWIR BTs during periods of stray light contamination. Despite being developed for selected regions, the AI model can be applied beyond these areas, providing stable MWIR BT generation during periods of stray light contamination for the AGRI observational area over extended periods. Consequently, the findings of our study contribute to advancing meteorological applications by facilitating identification and monitoring of phenomena such as sea fog, and low clouds around midnight.
Acknowledgments
The authors would like to thank the editors and anonymous reviewers for their helpful comments and valuable suggestions, which improved the paper. The FY-4A satellite data are provided by the National Satellite Meteorological Centre of China Meteorological Administration.
Fig.
7.
As in Fig. 6, but for results at 1700 UTC 31 October 2021.
Fig.
2.
The deep learning model used for generating the MWIR band. BN indicates batch normalization, Relu indicates activation function, and the pink and blue rectangular boxes are feature maps. DSC: depth-separable convolution, CBAM: convolutional block attention module.
Fig.
3.
Pixel-by-pixel AI-generated MWIR BTs compared with AGRI observations: (a) density scatter plots of observations and generated BTs and (b) probability density functions.
Fig.
4.
Comparison of (a, b) observed and (c, d) AI-generated MWIR band BTs at 1800 UTC 5 December 2020. Note that (a) and (c) cover southern India and the Indian Ocean region, and (b) cover Western Australia and (d) the Indian Ocean region.
Fig.
5.
Frequency distribution of observed (1500, 1600, 1700, 1800, and 1900 UTC) and AI-generated (1600, 1700, and 1800 UTC) MWIR BTs within 1-K intervals in (a) March, (b) April, (c) September, and (d) October 2021.
Fig.
6.
Comparisons of MWIR BTs (top row) and BTDs (bottom row) among the FY-4A AGRI-observed, AI-generated, GK-2A AMI-observed, and Himawari-8 AHI-observed BTs at 1600 UTC 29 October 2021.
Table
1
Characteristics of the FY-4A AGRI, GK-2A AMI, and Himawari-8 AHI bands used in this study (FWHM: full width at half maximum, NEΔT: noise-equivalent differential temperature). Detailed information can be found at https://space.oscar.wmo.int/
Satellite
Band type
Band No.
Central wavelength (µm)
Bandwidth (FWHM) (µm)
NEΔT @specified input
Spatial resolution (km)
Main purpose
FY-4A
MWIR
8
3.75
0.50
0.20 K @ 300 K
4
Land surface, fog, cloud
LWIR
9
6.25
0.90
0.20 K @ 300 K
4
High-level water vapor
10
7.10
0.40
0.25 K @ 300 K
4
Mid-level water vapor
11
8.55
1.00
0.20 K @ 300 K
4
Volcanic ash, cloud top phase
12
10.80
0.80
0.20 K @ 300 K
4
Surface temperature
13
12.00
1.00
0.20 K @ 300 K
4
Surface temperature
14
13.50
0.60
0.50 K @ 300 K
4
Cloud, air temperature
GK-2A
MWIR
7
3.83
0.19
0.18 K @ 300 K
2
Low cloud, fog, forest fires
LWIR
15
12.36
1.11
0.12 K @ 300 K
2
Surface temperature
Himawari-8
MWIR
7
3.85
0.22
≤ 0.16 K @ 300 K
2
Low cloud, fog, forest fires
LWIR
15
12.35
0.30
≤ 0.10 K @ 300 K
2
Cloud imagery, sea surface temperature
Note: FWHM: full width at half maximum and NEΔT: noise-equivalent differential temperature. Detailed information can be found at https://space.oscar.wmo.int/.
Baum, B. A., R. A. Frey, G. G. Mace, et al., 2003: Nighttime multilayered cloud detection using MODIS and ARM data. J. Appl. Meteorol., 42, 905–919, https://doi.org/10.1175/1520-0450(2003)042<0905:NMCDUM>2.0.CO;2. doi: 10.1175/1520-0450(2003)042<0905:NMCDUM>2.0.CO;2
Bessho, K., K. Date, M. Hayashi, et al., 2016: An introduction to Himawari-8/9—Japan’s new-generation geostationary meteorological satellites. J. Meteor. Soc. Japan. Ser. II, 94, 151–183, https://doi.org/10.2151/jmsj.2016-009.
Cheng, W. C., Q. H. Li, Z. G. Wang, et al., 2022: Creating synthetic night-time visible-light meteorological satellite images using the GAN method. Remote Sens. Lett., 13, 738–745, https://doi.org/10.1080/2150704X.2022.2079016.
Chollet, F., 2017: Xception: Deep learning with depthwise separable convolutions. Proceedings of 2017 IEEE Conference on Computer Vision and Pattern Recognition, IEEE, Honolulu, HI, USA, 1800–1807, doi: https://doi.org/10.1109/CVPR.2017.195.
Dong, L. X., S. H. Tang, F. Z. Wang, et al., 2023: Inversion and validation of FY-4A official land surface temperature product. Remote Sens., 15, 2437, https://doi.org/10.3390/rs15092437.
Ebert-Uphoff, I., and K. Hilburn, 2020: Evaluation, tuning, and interpretation of neural networks for working with images in meteorological applications. Bull. Amer. Meteor. Soc., 101, E2149–E2170, https://doi.org/10.1175/BAMS-D-20-0097.1.
Guo, Q., J. M. Xu, and W. J. Zhang, 2005: Stray light modelling and analysis for the FY-2 meteorological satellite. Int. J. Remote Sens., 26, 2817–2830, https://doi.org/10.1080/01431160500034292.
Han, L., H. Liang, H. N. Chen, et al., 2022: Convective precipitation nowcasting using U-Net model. IEEE Trans. Geosci. Remote Sens., 60, 4103508, https://doi.org/10.1109/TGRS.2021.3100847.
Hu, X. Q., N. Xu, F. Z. Weng, et al., 2013: Long-term monitoring and correction of FY-2 infrared channel calibration using AIRS and IASI. IEEE Trans. Geosci. Remote Sens., 51, 5008–5018, https://doi.org/10.1109/TGRS.2013.2275871.
Huangfu, J., Z. Q. Hu, J. F. Zheng, et al., 2024: Study on quantitative precipitation estimation by polarimetric radar using deep learning. Adv. Atmos. Sci., 41, 1147–1160, https://doi.org/10.1007/s00376-023-3039-0.
Iwabuchi, H., M. Saito, Y. Tokoro, et al., 2016: Retrieval of radiative and microphysical properties of clouds from multispectral infrared measurements. Prog. Earth Planet. Sci., 3, 32, https://doi.org/10.1186/s40645-016-0108-3.
Kim, K., J. H. Kim, Y. J. Moon, et al., 2019: Nighttime reflectance generation in the visible band of satellites. Remote Sens., 11, 2087, https://doi.org/10.3390/rs11182087.
Kingma, D. P., and J. Ba, 2014: Adam: A method for stochastic optimization. Proceedings of the 3rd International Conference on Learning Representations, ICLR, San Diego, CA, USA. Available online at https://doi.org/10.48550/arXiv.1412.6980. Accessed on 9 January 2025.
Lee, T. F., F. J. Turk, and K. Richardson, 1997: Stratus and fog products using GOES-8–9 3.9-μm data. Wea. Forecasting, 12, 664–677, https://doi.org/10.1175/1520-0434(1997)012<0664:SAFPUG>2.0.CO;2. doi: 10.1175/1520-0434(1997)012<0664:SAFPUG>2.0.CO;2
Li, X., Y. C. Jiang, H. Peng, et al., 2019: An aerial image segmentation approach based on enhanced multi-scale convolutional neural network. Proceedings of 2019 IEEE International Conference on Industrial Cyber Physical Systems (ICPS), IEEE, Taipei, 47–52, https://doi.org/10.1109/ICPHYS.2019.8780187.
Meng, X. C., J. Cheng, H. Guo, et al., 2024: Quality assessment of FY-4A/AGRI official sea surface temperature product. IEEE Geosci. Remote Sens. Lett., 21, 1500905, https://doi.org/10.1109/LGRS.2024.3350585.
Min, M., J. Li, F. Wang, et al., 2020: Retrieval of cloud top properties from advanced geostationary satellite imager measurements based on machine learning algorithms. Remote Sens. Environ., 239, 111616, https://doi.org/10.1016/j.rse.2019.111616.
Niu, Z., L. Zhang, Y. Han, et al., 2023: Performances between the FY-4A/GIIRS and FY-4B/GIIRS long-wave infrared (LWIR) channels under clear-sky and all-sky conditions. Quart. J. Roy. Meteor. Soc., 149, 1612–1628, https://doi.org/10.1002/qj.4473.
Oh, S. M., R. Borde, M. Carranza, et al., 2019: Development and intercomparison study of an atmospheric motion vector retrieval algorithm for GEO-KOMPSAT-2A. Remote Sens., 11, 2054, https://doi.org/10.3390/rs11172054.
Ronneberger, O., P. Fischer, and T. Brox, 2015: U-Net: Convolutional networks for biomedical image segmentation. Proceedings of the 18th International Conference on Medical Image Computing and Computer-Assisted Intervention—MICCAI 2015, Springer, Munich, Germany, 234–241, doi: https://doi.org/10.1007/978-3-319-24574-4_28.
Schmit, T. J., S. S. Lindstrom, J. J. Gerth, et al., 2018: Applications of the 16 spectral bands on the Advanced Baseline Imager (ABI). J. Oper. Meteorol., 6, 33–46, https://doi.org/10.15191/nwajom.2018.0604.
Shao, J. L., H. Gao, X. Wang, et al., 2020: Application of Fengyun-4 satellite to flood disaster monitoring through a rapid multi-temporal synthesis approach. J. Meteorol. Res., 34, 720–731, https://doi.org/10.1007/s13351-020-9184-9.
Shu, A. Q., F. F. Shen, L. P. Jiang, et al., 2023: Assimilation of clear-sky FY-4A AGRI radiances within the WRFDA system for the prediction of a landfalling Typhoon Hagupit (2020). Atmos. Res., 283, 106556, https://doi.org/10.1016/j.atmosres.2022.106556.
Sun, F. L., B. Li, M. Min, et al., 2021: Deep learning-based radar composite reflectivity factor estimations from Fengyun-4A geostationary satellite observations. Remote Sens., 13, 2229, https://doi.org/10.3390/rs13112229.
Tang, F., X. Y. Zhuge, M. J. Zeng, et al., 2021: Applications of the advanced radiative transfer modeling system (ARMS) to characterize the performance of Fengyun-4A/AGRI. Remote Sens., 13, 3120, https://doi.org/10.3390/rs13163120.
Trebing, K., T. Staǹczyk, and S. Mehrkanoon, 2021: SmaAt-UNet: Precipitation nowcasting using a small attention-UNet architecture. Pattern Recogn. Lett., 145, 178–186, https://doi.org/10.1016/j.patrec.2021.01.036.
Veillette, M. S., S. Samsi, and C. J. Mattioli, 2020: SEVIR: A storm event imagery dataset for deep learning applications in radar and satellite meteorology. Proceedings of the 34th International Conference on Neural Information Processing Systems, Curran Associates Inc., Vancouver, BC, Canada, 22,009–22,019.
Wang, Q., C. Zhou, X. Y. Zhuge, et al., 2022: Retrieval of cloud properties from thermal infrared radiometry using convolutional neural network. Remote Sens. Environ., 278, 113079, https://doi.org/10.1016/j.rse.2022.113079.
Weaver, J. F., D. Lindsey, D. Bikos, et al., 2004: Fire detection using GOES rapid scan imagery. Wea. Forecasting, 19, 496–510, https://doi.org/10.1175/1520-0434(2004)019<0496:FDUGRS>2.0.CO;2. doi: 10.1175/1520-0434(2004)019<0496:FDUGRS>2.0.CO;2
Woo, S., J. Park, J. Y. Lee, et al., 2018: CBAM: Convolutional block attention module. Proceedings of the 15th European Conference on Computer Vision (ECCV), Springer, Munich, Germany, 3–19, doi: https://doi.org/10.1007/978-3-030-01234-2_1.
Wu, A. K., M. Hou, and C. Zhang, 2022: Quantitative characteristics analysis of FY4A satellite products during a thunderstorm weather process. Meteor. Environ. Res., 13 , 49–54.
Xie, L. N., S. Wu, R. H. Wu, et al., 2023: Cross-comparison of radiation response characteristics between the FY-4B/AGRI and GK-2A/AMI in China. Remote Sens., 15, 779, https://doi.org/10.3390/rs15030779.
Xu, L., W. Cheng, Z. R. Deng, et al., 2023: Assimilation of the FY-4A AGRI clear-sky radiance data in a regional numerical model and its impact on the forecast of the “21·7” Henan extremely persistent heavy rainfall. Adv. Atmos. Sci., 40, 920–936, https://doi.org/10.1007/s00376-022-1380-3.
Yao, J. H., P. Y. Du, Y. C. Zhao, et al., 2024: Simulating nighttime visible satellite imagery of tropical cyclones using conditional generative adversarial networks. arXiv preprint arXiv: 2401.11679, https://doi.org/10.48550/arXiv.2401.11679.
You, S. L., Y. T. Peng, and G. L. Chen, 2006: Anlysis on stray radiation in FY-2 imager during midnight. Opt. Tech., 32, 688–694. (in Chinese)
Zhang, C. W., X. D. Zhou, X. Y. Zhuge, et al., 2021: Learnable optical flow network for radar echo extrapolation. IEEE J. Sel. Top. Appl. Earth Obs. Remote Sens., 14, 1260–1266, https://doi.org/10.1109/JSTARS.2020.3031244.
Zhang, P., L. Zhu, S. H. Tang, et al., 2019: General comparison of FY-4A/AGRI with other GEO/LEO instruments and its potential and challenges in non-meteorological applications. Front. Earth Sci., 6, 224, https://doi.org/10.3389/feart.2018.00224.
Zhao, Z. J., F. Zhang, Q. Wu, et al., 2023: Cloud identification and properties retrieval of the Fengyun-4A satellite using a Res-Unet model. IEEE Trans. Geosci. Remote Sens., 61, 1–18, https://doi.org/10.1109/TGRS.2023.3252023.
Zhou, K. H., J. S. Sun, Y. G. Zheng, et al., 2022: Quantitative precipitation forecast experiment based on basic NWP variables using deep learning. Adv. Atmos. Sci., 39, 1472–1486, https://doi.org/10.1007/s00376-021-1207-7.
Zhu, J., J. Shu, and W. Guo, 2020: Biases characteristics assessment of the Advanced Geosynchronous Radiation Imager (AGRI) measurement on board Fengyun-4A geostationary satellite. Remote Sens., 12, 2871, https://doi.org/10.3390/rs12182871.
Zhu, Z., C. X. Shi, and J. X. Gu, 2023: Characterization of bias in Fengyun-4B/AGRI infrared observations using RTTOV. Remote Sens., 15, 1224, https://doi.org/10.3390/rs15051224.
Zhuge, X., and X. Zou, 2016: Test of a modified infrared-only ABI cloud mask algorithm for AHI radiance observations. J. Appl. Meteor. Climatol., 55, 2529–2546, https://doi.org/10.1175/JAMC-D-16-0254.1.
Zhuge, X. Y., X. L. Zou, L. Yu, et al., 2024: Introduction to the NJIAS Himawari-8/9 cloud feature dataset for climate and typhoon research. Earth Syst. Sci. Data, 16, 1747–1769, https://doi.org/10.5194/essd-16-1747-2024.
Xiao, H. X., X. Y. Zhuge, F. Tang, et al., 2025: Expedient mid-wave infrared band generation for AGRI during stray light contamination periods using a deep learning model. J. Meteor. Res., 39(1), 211–222, https://doi.org/10.1007/s13351-025-4107-4.
Xiao, H. X., X. Y. Zhuge, F. Tang, et al., 2025: Expedient mid-wave infrared band generation for AGRI during stray light contamination periods using a deep learning model. J. Meteor. Res., 39(1), 211–222, https://doi.org/10.1007/s13351-025-4107-4.
Xiao, H. X., X. Y. Zhuge, F. Tang, et al., 2025: Expedient mid-wave infrared band generation for AGRI during stray light contamination periods using a deep learning model. J. Meteor. Res., 39(1), 211–222, https://doi.org/10.1007/s13351-025-4107-4.
Citation:
Xiao, H. X., X. Y. Zhuge, F. Tang, et al., 2025: Expedient mid-wave infrared band generation for AGRI during stray light contamination periods using a deep learning model. J. Meteor. Res., 39(1), 211–222, https://doi.org/10.1007/s13351-025-4107-4.
Export: BibTexEndNote
Article Metrics
Article views: 136 PDF downloads: 48Cited by:
Manuscript History
Received: 13 June 2024
Revised: 31 October 2024
Accepted: 08 November 2024
Available online: 11 November 2024
Final form: 25 November 2024
Typeset Proofs: 16 December 2024
Issue in Progress: 02 January 2025
Published online: 20 February 2025
Share
Catalog
Abstract
摘要
1.
Introduction
2.
Data and method
2.1
FY-4A AGRI data
2.2
GK-2A AMI data
2.3
Himawari-8 AHI data
2.4
Model architecture
2.5
Experimental setting
3.
Results
3.1
Evaluation using normal radiance measurements
3.2
Application during stray light contamination periods
Table
1.
Characteristics of the FY-4A AGRI, GK-2A AMI, and Himawari-8 AHI bands used in this study (FWHM: full width at half maximum, NEΔT: noise-equivalent differential temperature). Detailed information can be found at https://space.oscar.wmo.int/
Note: FWHM: full width at half maximum and NEΔT: noise-equivalent differential temperature. Detailed information can be found at https://space.oscar.wmo.int/.


 DownLoad: